Test- FTSE 100 Kicks Off August on a High as BP and Senior Lead Market Momentum
$11
10 Oct 2025, 13:13

Chart & Data from IG

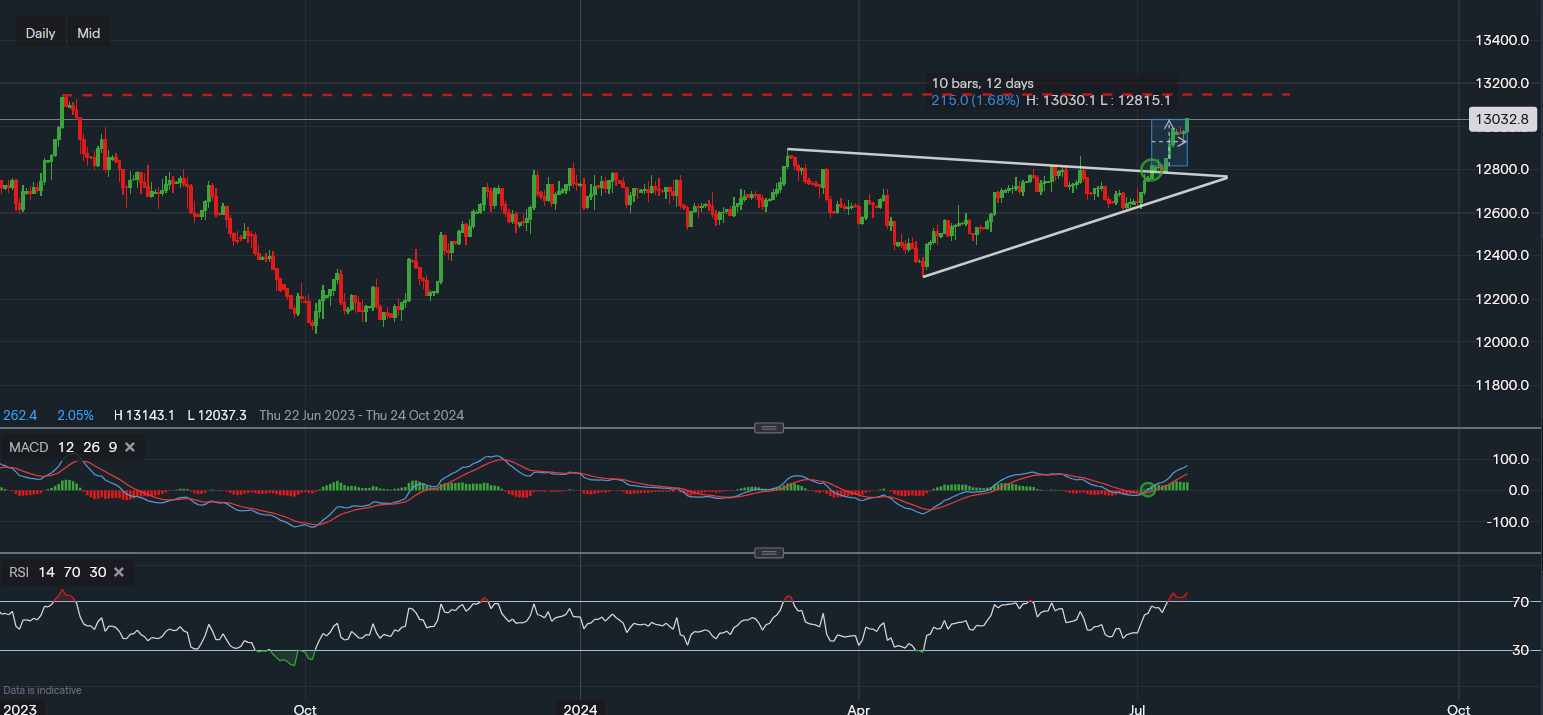
Taking a look at the pound versus the US dollar as the cable has hit $1.30 for the first time since this time last year. Currently, the pair is trading at around $1.3032 following a breakout towards the upside on the 5th of July. We can see the pair broke out of the triangle drawn on the chart and has rallied almost 1.7% since. The next point of resistance can be found around $1.3143 (red dotted trendline), which is also the high of July 2023. This level will most definitely act as resistance, perhaps restricting the pair from moving higher in the near term. However, a break and close above this level would incentivise the bulls to then target the area of $1.32-$1.33 as that’s where the next point of resistance lies. $1.32-$1.33 was last seen back in March of 2022. Towards the downside, the bulls now have support at $1.2938. Only a move below this level may lead to a lower pullback in order to test support between $1.2850-$1.2890 (previous attempts of breaking higher). Looking at the technical indicators, the MACD is strongly positive and so is the RSI as it reads 77. Though the RSI now suggests that the market is slightly overbought, hence, slight profit-taking may take place in order to allow room for consolidation.