Test- FTSE 100 Kicks Off August on a High as BP and Senior Lead Market Momentum
$11
10 Oct 2025, 13:13
Neutral
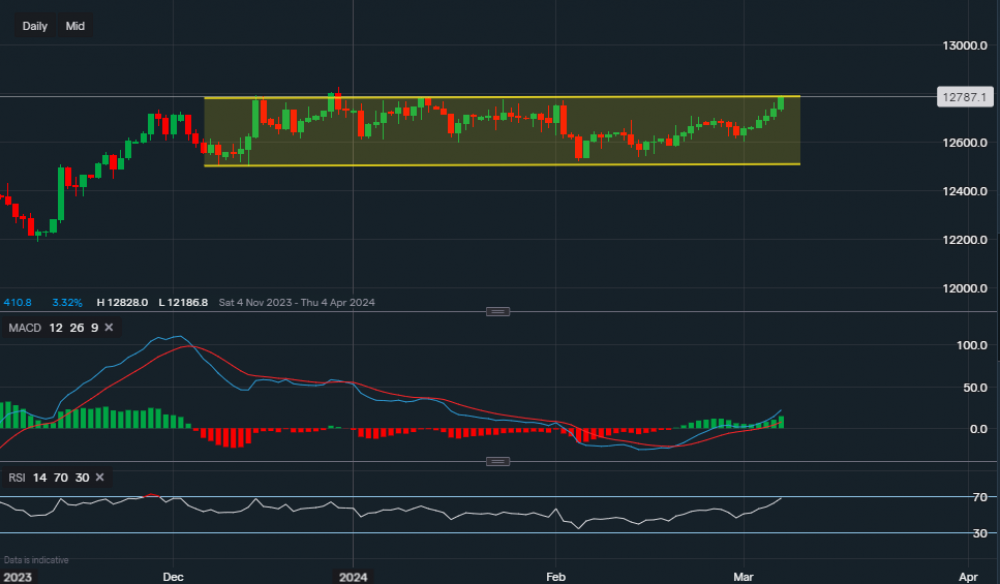
Chart & Data from IG
The pound is still trading within the channel drawn on the chart against the dollar, but once again it has approached the resistance along the upper trendline of the channel. Currently, the forex pair is trading at around £1.2787, with the key resistance here of £1.2794, though it has reached a high previously of £1.2828. If we see a break and close above £1.2828 then the bulls would certainly eye up the £1.29 level. The last time GBP/USD was around £1.29 was back in July when the market experienced a hefty correction, in turn, the dollar was strengthening. The pound has now risen for 5 consecutive days and clearly has momentum behind so a breakout here cannot be ruled out. Support now sits at £1.2719 then at £1.2673. A break and close below £1.2673 would suggest that the strength behind the dollar is greater than assumed, which could then see a pullback towards £1.26. Looking at the technical indicators, the MACD is positive and so is the RSI as it reads 68.

Tradable assets:
Min.Deposit:
Max Leverage:
FCA:

Rating:


