Test- FTSE 100 Kicks Off August on a High as BP and Senior Lead Market Momentum
$11
10 Oct 2025, 13:13
Neutral
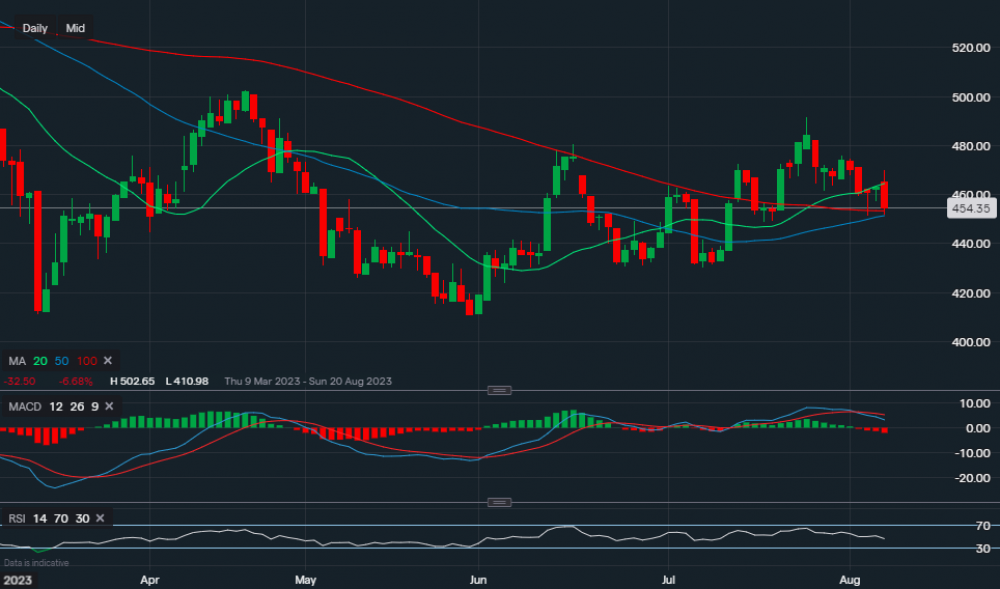
Chart & Data from IG
Glencore is currently trading at around 454p a share. We can see that on the daily timeframe, its stock price has risen above the 100-day moving average, however, it soon retraced back to it. The support is sat at 451p and then at 453p, which corresponds both with the 50 and 100-day MAs. A dip below these moving averages, in theory, would be an indication of a move lower. If so, we would then look at support sitting at 430p. Consolidation around current levels would allow us to potentially look towards the upside, resistance is currently at 462p then at 472p and then at 479p. A move above 479p may even see a stretch to 491p. Looking at the technical indicators, MACD is negative but the RSI is neutral as it reads 46.


