Test- FTSE 100 Kicks Off August on a High as BP and Senior Lead Market Momentum
$11
10 Oct 2025, 13:13
Neutral
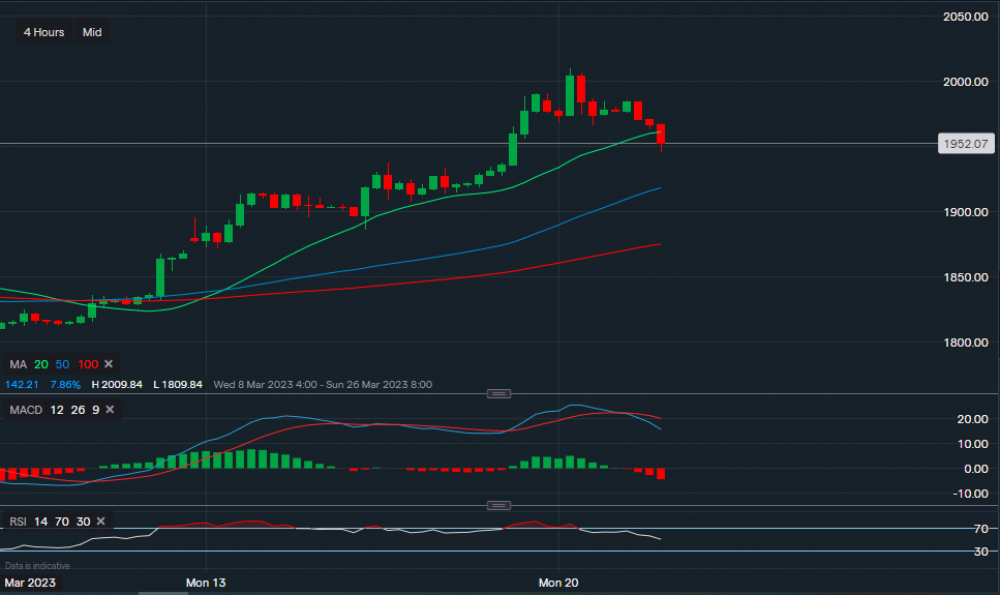
Chart & Data from IG
On the 4 hourly timeframe we can see that gold has now dipped below the 20-day moving average, or the support level of $1,960. The price of gold could now retrace further towards roughly $1,917, also the current position of the 50-day MA. A break below the 50-day MA may even see a further decline towards $1,874, which is the present position of the 100-day MA. However, the longer term outlook is still bullish, therefore, previous support of $1,960 is now acting as resistance. Followed by a level at $1,985, a break above this resistance level could see the price of gold head back up towards the 2023 high reached yesterday ($2,009). MACD has turned negative on the 4-hourly and RSI has faltered as it now reads 50, sitting in a neutral position after being overbought since last Friday till early Monday.

Tradable assets:
Min.Deposit:
Max Leverage:
FCA:

Rating:


