Test- FTSE 100 Kicks Off August on a High as BP and Senior Lead Market Momentum
$11
10 Oct 2025, 13:13
Neutral
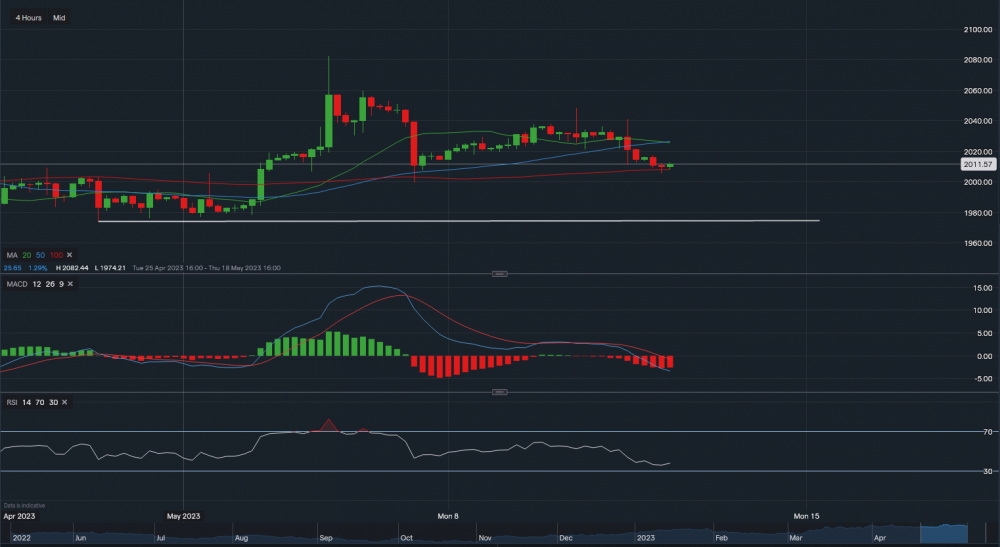
Chart & Data from IG
Gold has approached the 100-day moving average on the 4-hourly timeframe, the 100-day MA is acting as a great support level for the commodity. Gold currently trading at around $2,011 an ounce with the support below at $2,008. A break and close below the moving average could see its price slide lower, towards the next major support base resting at $1,974. However, if we see some consolidation around its current level, then resistance above is located at $2,025. Which corresponds with the 20 and 50-day moving averages. A break above $2,025 could see a move higher towards $2,041 and then even $2,048. Looking at the indicators, MACD is negative and so is RSI as it reads 37.

Tradable assets:
Min.Deposit:
Max Leverage:
FCA:

Rating:


