Test- FTSE 100 Kicks Off August on a High as BP and Senior Lead Market Momentum
$11
10 Oct 2025, 13:13
Neutral
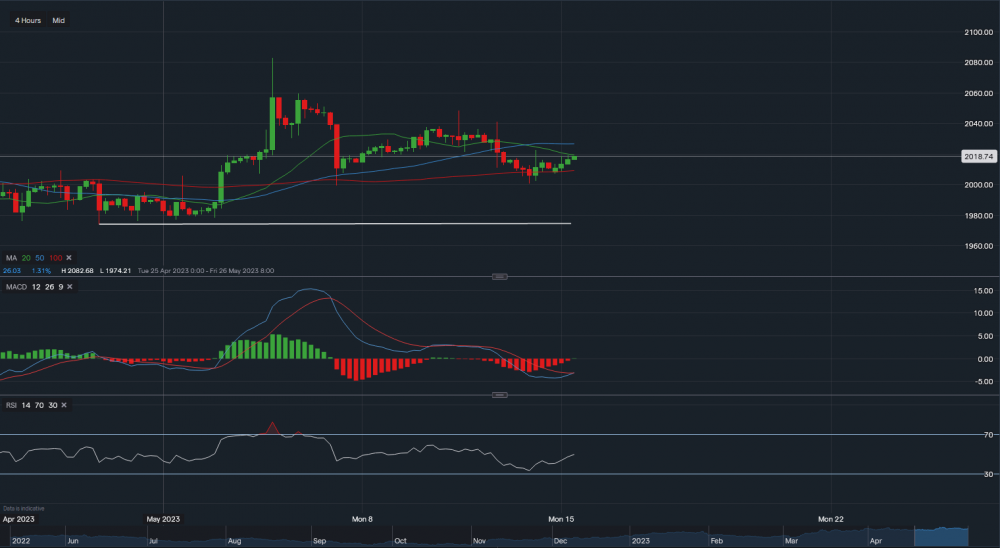
Chart & Data from IG
Gold looks like it may have consolidated along the 100-day moving average last Friday, dipping below the support of $2,008 creating a new support level of $2,000. Now trading above the moving average and approaching the resistance at $2,019 (20-day MA). A break above it could see a move towards $2,026 (50-day MA), which would be the next key resistance point. Currently trading at around $2,018 an ounce, with the support levels below of $2,008 then $2,007, and finally the key support of $2,000. A break below $2,000 may see the price slide further towards $1,975-$1,980 an ounce (white trendline). Taking a look at the indicators, MACD is neutral but seems like it’s turning positive on the 4 hourly timeframe and RSI is rising as it now reads 49.

Tradable assets:
Min.Deposit:
Max Leverage:
FCA:

Rating:


