Test- FTSE 100 Kicks Off August on a High as BP and Senior Lead Market Momentum
$11
10 Oct 2025, 13:13
Neutral
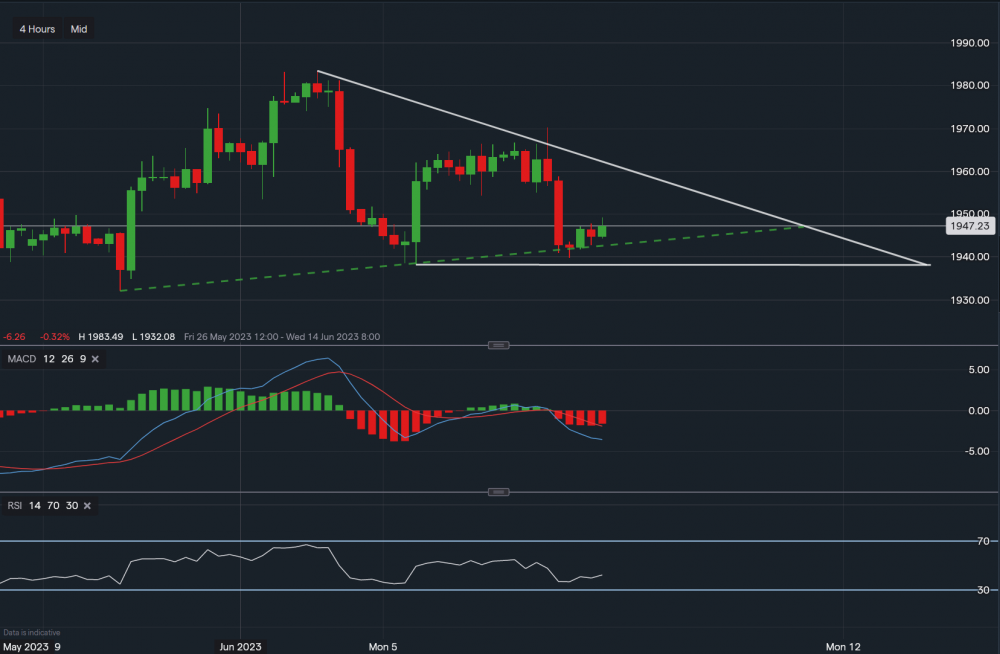
Chart & Data from IG
Gold is currently trading at around $1,947 an ounce. The price has created higher lows on two separate occasions since the 30th of May, one at $1,938 on the 5th of June and then at $1,939 on the 7th of June. This is highlighted by the ascending green trendline. A break below $1,938 could see the price slide lower towards $1,932. Towards the upside, resistance sits at $1,949 then at $1,957 (along the descending trendline of the triangle). A positive break out of the triangle may see the price of gold climb its way higher, with the target then of $1,965-$1,970 an ounce. Looking at the technical indicators, MACD is negative and the RSI is negative as it reads 41, but it’s rising.

Tradable assets:
Min.Deposit:
Max Leverage:
FCA:

Rating:


