Test- FTSE 100 Kicks Off August on a High as BP and Senior Lead Market Momentum
$11
10 Oct 2025, 13:13
Neutral
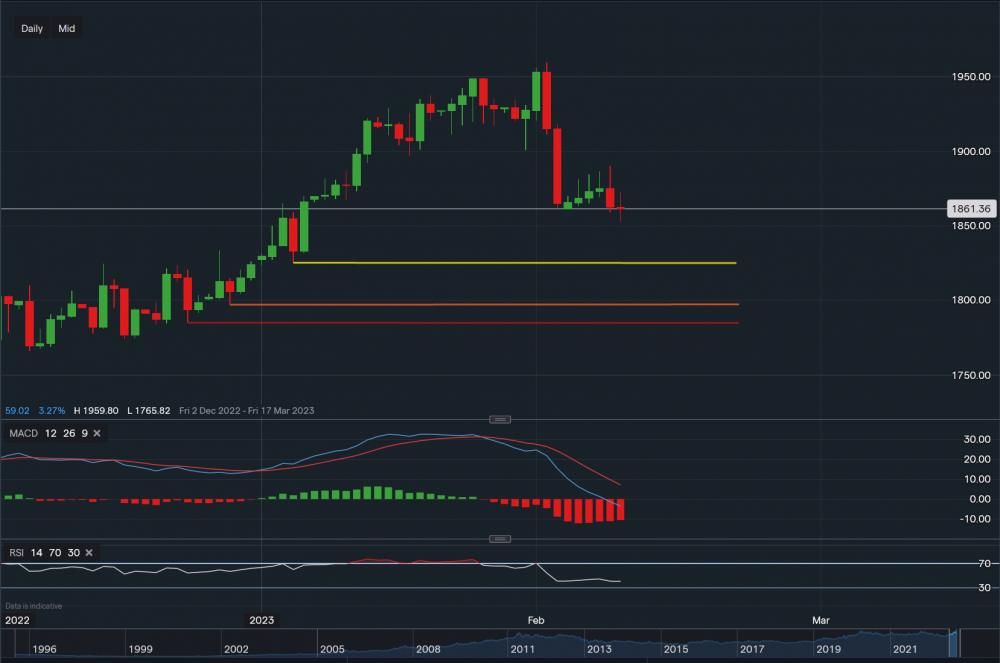
Gold - Chart & Data from IG
From a technical viewpoint, we can see that gold has tried to hold on the last few days but the bearish pressure is overpowering. Looking on the daily interval, support below sits at $1,825 (yellow trendline) then at $1,797 (orange) then at $1,784 (red). A break below the red trendline may see the price of gold decline as far as $1,72, which would suggest a longer-term bearish trend could be forming. However, the long-term bias is still positive with a resistance level at $1,872 then at $1,881 then $1,890. A break above $1,890 could see the price continue higher back up to the $1,900 level. Both of the technical indicators are currently negative with an RSI reading of 40.

Tradable assets:
Min.Deposit:
Max Leverage:
FCA:

Rating:


