Test- FTSE 100 Kicks Off August on a High as BP and Senior Lead Market Momentum
$11
10 Oct 2025, 13:13
Neutral
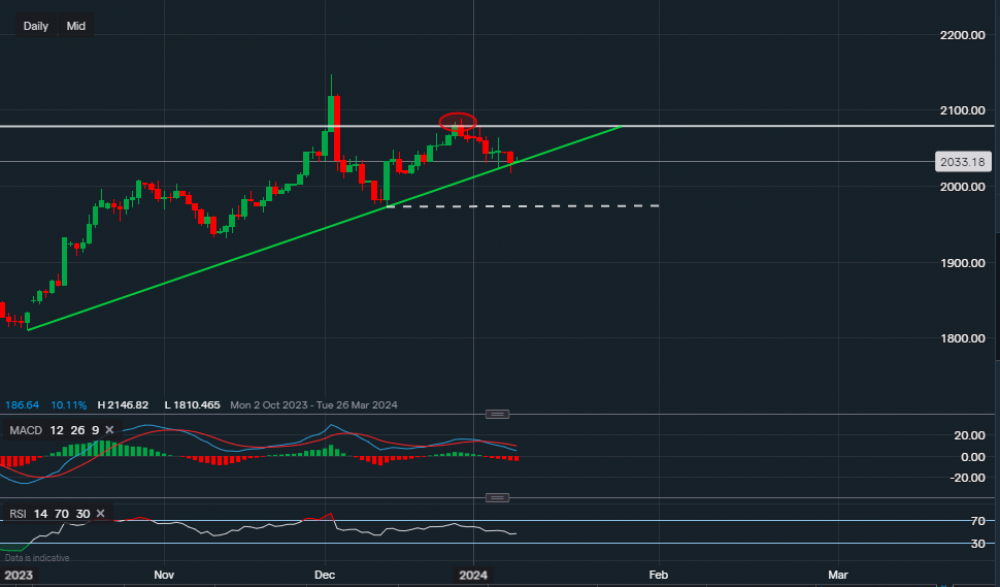
Chart & Data from IG
Gold continues with the retracement for the time being after the rejection to move higher (red oval) along the upper white trendline. Currently, the commodity is trading at around $2,033 an ounce, and it has clearly just approached a key support here. The green trendline offers support that dates back to the 6th of October, yesterday the price fell below reaching a low of $2,016 but the commodity managed to close just above the trendline at $2,030 an ounce. The support sits directly along the green trendline and reads $2,030, which is also yesterday’s closing price. If a close below this level occurs today then this may be a bearish indication that more downside is possible. However, if the support is upheld, we could see a push higher back towards the trendline resistance. The resistance level can be seen at $2,047 then at $2,064 and finally the trendline resistance of $2,079. Looking at the technical indicators, they suggest a mixed approach. The MACD is slightly negative whereas the RSI is neutral, reading 47.

Tradable assets:
Min.Deposit:
Max Leverage:
FCA:

Rating:


