Test- FTSE 100 Kicks Off August on a High as BP and Senior Lead Market Momentum
$11
10 Oct 2025, 13:13
Neutral
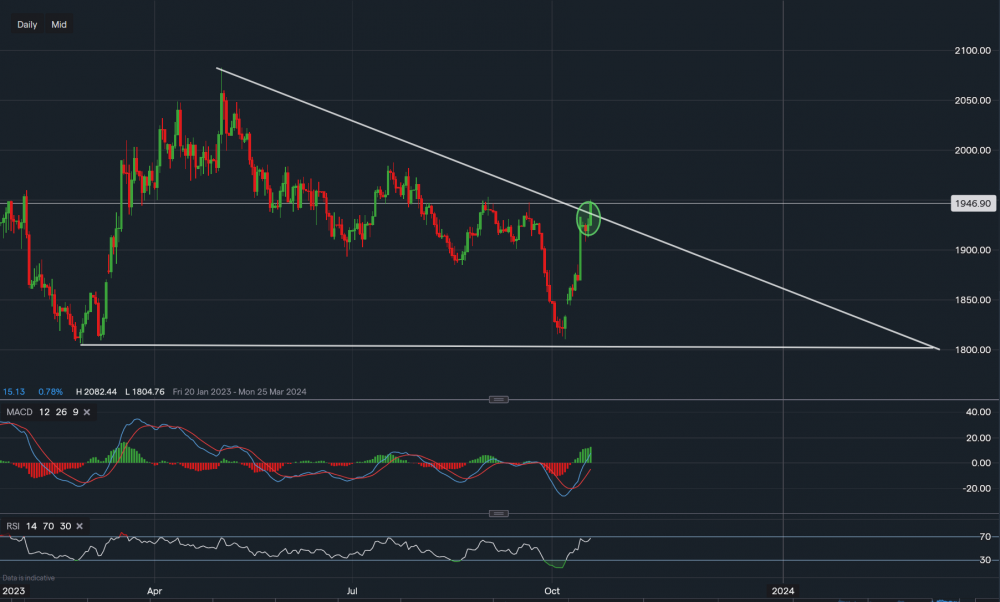
Chart & Data from IG
Taking a look at gold on this occasion. It seems like the commodity may have broken out of the descending triangle and towards the upside. Currently, gold is trading at around $1,946 an ounce and the breakout point is highlighted by the green oval on the chart. The resistance now sits at $1,953 and then $1,959. A break above $1,959 could see the price rise further towards $1,975-$1,980. However, there isn’t a clear confirmation as of yet of this breakout until the price closes in today’s session above the descending trendline. Support now can be found at $1,935, which sits along the trendline. On some occasions, markets retrace to re-test the trendline support in order to consolidate before heading higher. This could be the case for this market, but of course, it’s not guaranteed and could as likely fall back into the triangle pattern area. However, if we shift over to the technical indicators, we can see that momentum is strong as the MACD is positive with enlarged volume, and the RSI remains positive after a slight dip as it reads 67.

Tradable assets:
Min.Deposit:
Max Leverage:
FCA:

Rating:


