Test- FTSE 100 Kicks Off August on a High as BP and Senior Lead Market Momentum
$11
10 Oct 2025, 13:13
Neutral
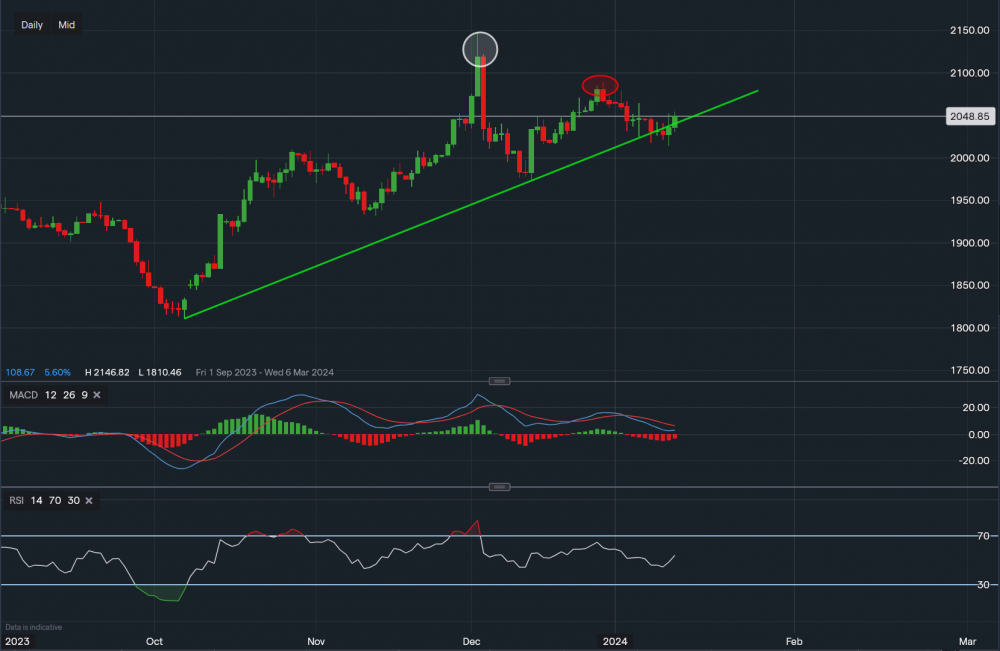
Chart & Data from IG
Taking a look at Gold as it was up as high as 1% earlier in the day, with the talks of further concerns in the Middle East investors may turn to safe haven assets such as gold. Currently, the commodity is trading at around $2,048 an ounce. We can see the supportive trendline is still intact, dating back to the 6th of October. The price dipped slightly below it over the last couple of days but it seems like the price could hold onto it, currently trading above it. If so, the bulls would then look towards the resistance of $2,088 (red oval). A break and close above this resistance would then shift the focus to the high of $2,146. Support remains along the trendline at $2,036 followed by yesterday’s low of $2,013. A move below $2,013 may see a retracement lower towards the area of $1,975-$2,000. Looking at the technical indicators, they are a little mixed. The MACD is slightly negative and the RSI is neutral but on the rise, reading 53.

Tradable assets:
Min.Deposit:
Max Leverage:
FCA:

Rating:


