Test- FTSE 100 Kicks Off August on a High as BP and Senior Lead Market Momentum
$11
10 Oct 2025, 13:13
Neutral
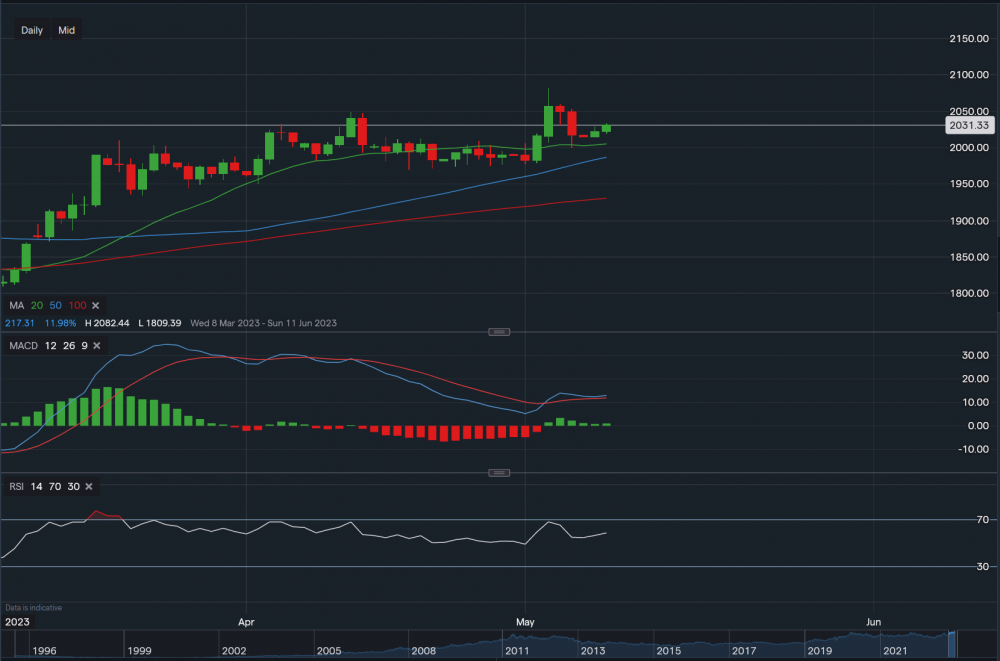
Chart & Data from IG
Taking a look at gold after yesterday was a positive day after last week’s rally and the Fed’s interest rate decision. At present, the commodity is trading at around $2,031 an ounce with great support levels below. Support sits at $2,005 (20-day MA) then at 1,986 (50-day MA). A break below the 50-day MA could see a retracement lower towards the 100-day MA, which currently reads $1,930. However, as the bias remains bullish let’s take a look at the potential upside, minor resistance sits at $2,032 followed by $2,048, and finally the tough point at $2,082. $2,082 was reached last week and stands as the all-time high, hence only a break above this point could see further upside. The target then would be $2,100 an ounce. Looking at the technical indicators, MACD is pretty flat but the RSI is positive as it reads 58.

Tradable assets:
Min.Deposit:
Max Leverage:
FCA:

Rating:


