Test- FTSE 100 Kicks Off August on a High as BP and Senior Lead Market Momentum
$11
10 Oct 2025, 13:13
Neutral
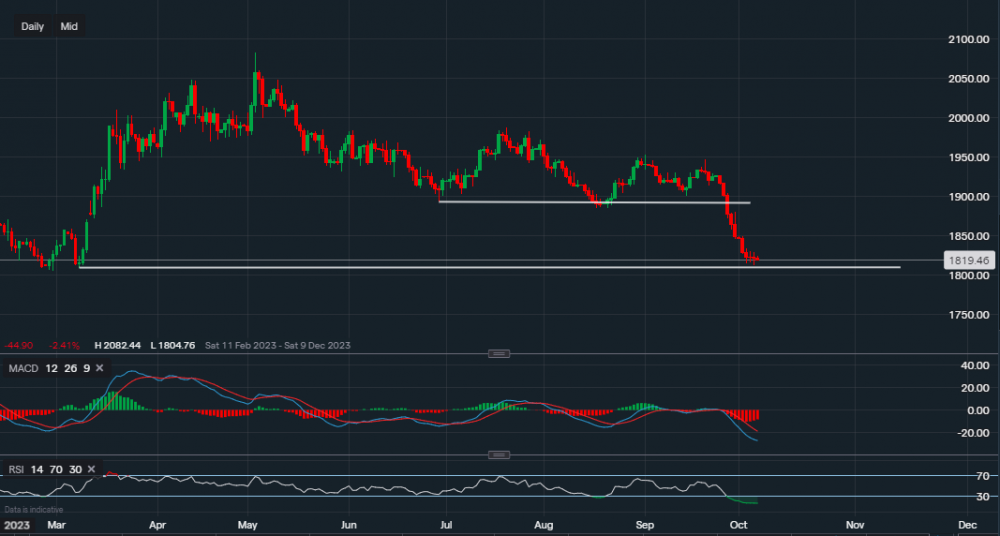
Chart & Data from IG
After the strong break below the support of $1,893 on the 27th of September, Gold has now approached the support of $1,809. Even though it hasn’t tested $1,809 as of yet, this is another key level for the commodity. Currently, it is trading at around $1,819 an ounce, but it seems like it is trying to consolidate around the current levels. The last two trading sessions have been very flat with no clear movement in either direction. The price of gold within those sessions closed pretty much at the same level, $1,822 on Wednesday and $1,821 on Thursday. If we look at the technical indicators, we can also see that the RSI is heavily oversold and has been since the 27th of September. However, the MACD is still strongly negative so if a bounce was to occur it could only be short-lived. Nevertheless, resistance sits at $1,829 and $1,830. A break above these levels could see an extension towards $1,849. Whereas support sits at $1,813 (yesterday’s low) followed by the key support of $1,809. Until $1,809 is broken the outlook is neutral for the time being.

Tradable assets:
Min.Deposit:
Max Leverage:
FCA:

Rating:


