Test- FTSE 100 Kicks Off August on a High as BP and Senior Lead Market Momentum
$11
10 Oct 2025, 13:13
Neutral
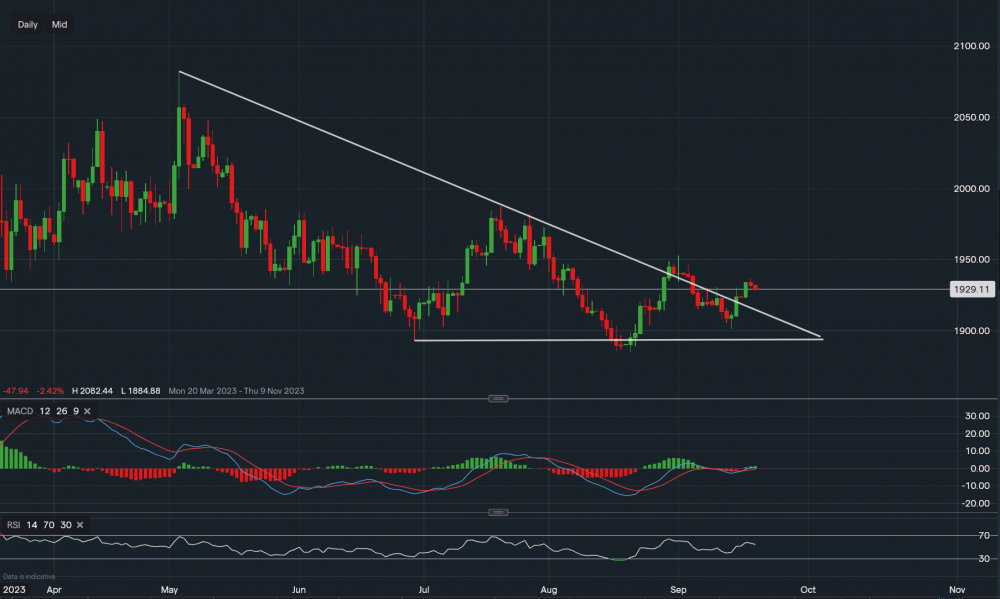
Chart & Data from IG
Gold has broken out of the descending triangle towards the upside based on the daily timeframe, however, it has not yet surpassed the key resistance of $1,953. Currently, the commodity is trading at around $1,929 an ounce, it now faces the resistance of $1,937 which is yesterday’s high. Even though Gold has created a higher low of $1,901, an indicator of a potentially new bullish trend, though this would only be confirmed if the level of $1,953 is broken. A move above $1,953 could see a stretch towards $1,970-$1,980. Towards the downside, support sits at $1,924 then along the descending trendline at $1,913. A break back into the triangle could see the price retest the base support of $1,893. Looking at the technical indicators, MACD is slightly positive and so is the RSI as it reads 55. Nevertheless, investors and traders should be cautious if entering in either direction over the next couple of days, as volatility may increase due to the scheduled FOMC meeting later today.

Tradable assets:
Min.Deposit:
Max Leverage:
FCA:

Rating:


