Test- FTSE 100 Kicks Off August on a High as BP and Senior Lead Market Momentum
$11
10 Oct 2025, 13:13
Neutral
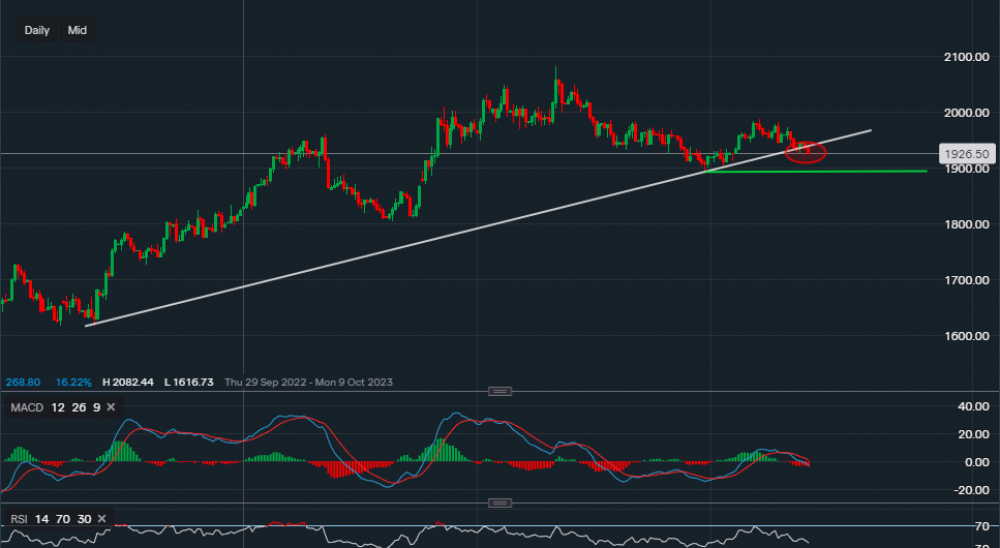
Chart & Data from IG
Gold has broken through the supportive trendline on the daily interval. This trendline support dates all the way back to November 2022, which could be a negative sign for the precious metal. Now gold is trading at around $1,926 an ounce and the break has been highlighted by the red oval on the chart. The next key support level sits at $1,893 and is highlighted by the green trendline. Only a fall below $1,893 would indicate that further downfalls are possible in the mid-term. The short-term bias remains bearish and we would only analyse towards the upside if consolidation around current levels takes place. Resistance targets at the moment are too difficult to gauge. Though investors/traders should be cautious if placing shorts as the market can be deceiving and false breakouts on all timeframes occur. Based on the technical indicators, as already mentioned above, the bias is bearish. MACD is negative and the RSI keeps on faltering as it now reads 39.

Tradable assets:
Min.Deposit:
Max Leverage:
FCA:

Rating:


