Test- FTSE 100 Kicks Off August on a High as BP and Senior Lead Market Momentum
$11
10 Oct 2025, 13:13
Neutral
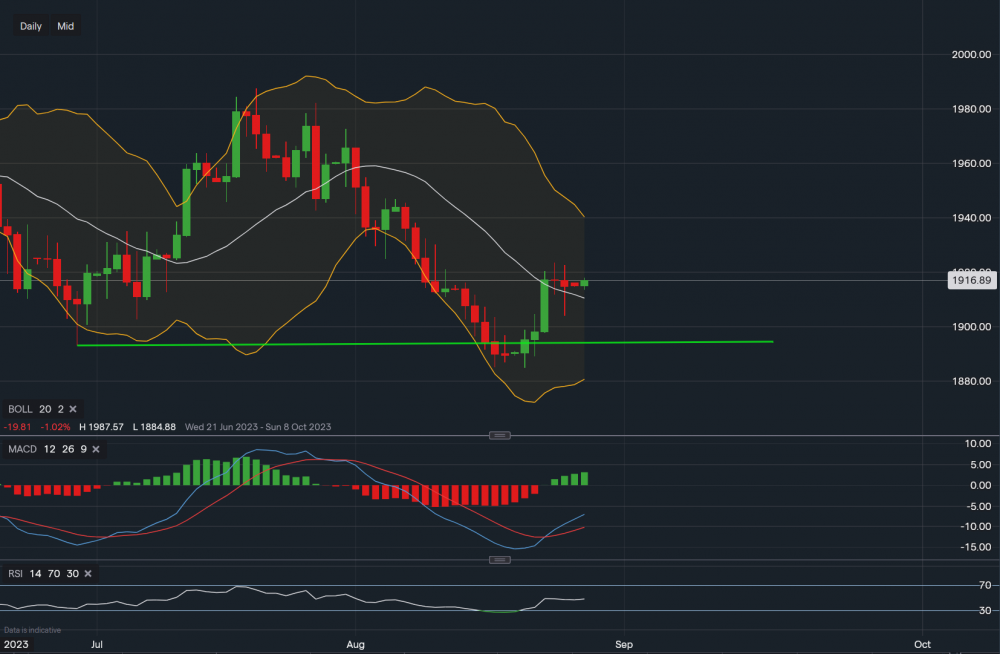
Chart & Data from IG
Taking a look at Gold as it seems to have consolidated around $1,884-$1,886, followed by a bounce higher last Wednesday. If we apply the Bollinger Bands on the daily timeframe, we can see the price has closed above the middle moving average at $1,917. Thursday, Friday and Sunday night have been flat, perhaps more consolidation with a slight pullback to the middle MA. This now may be a good opportunity for Gold to continue higher, we can see the first resistance at $1,923. A break above it could see a push higher towards $1,934 and then even the upper Bollinger Band, which currently reads $1,940. However, this is not guaranteed. Support now sits at $1,910 (middle MA) and then at $1,903 (Friday’s low), a break below $1,903 would indicate that more downside is possible with a move back towards the base of $1,893 (green trendline). Looking at the technical indicators, MACD is strongly positive and the RSI has now turned neutral as it reads 48.

Tradable assets:
Min.Deposit:
Max Leverage:
FCA:

Rating:


