Test- FTSE 100 Kicks Off August on a High as BP and Senior Lead Market Momentum
$11
10 Oct 2025, 13:13
Neutral
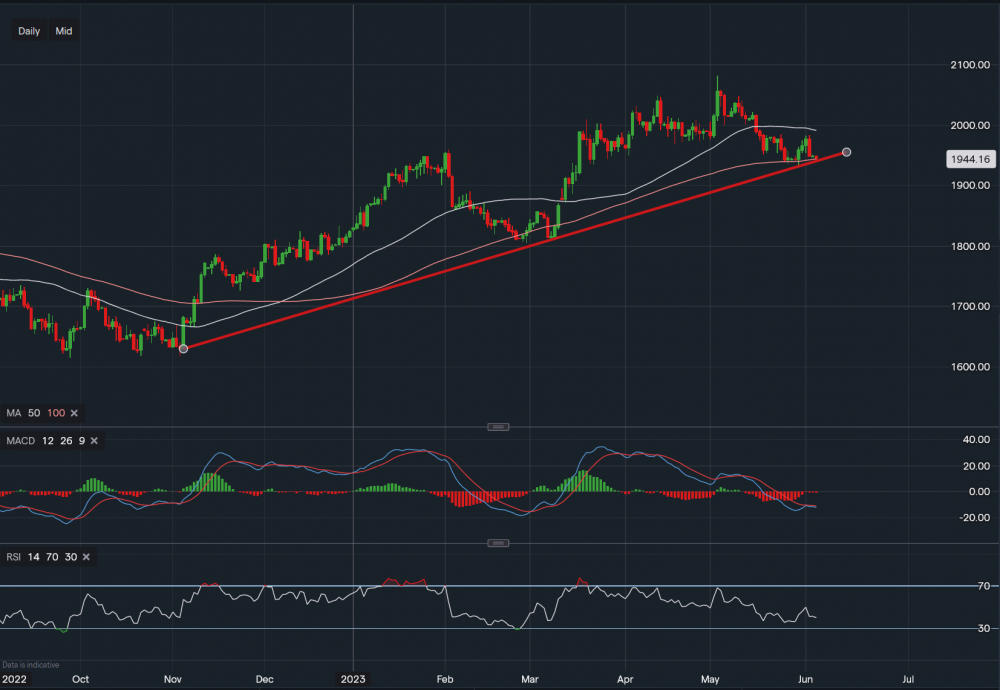
Gold - Chart data IG
Gold prices continue to falter as risk appetite returns to the markets in 2023.
Looking at the chart gold continues to struggle in the short term, however, significant trendline support dating back to November could now hold the market up. It's worth noting that MACD is negative and falling with RSI reading of 40, suggesting a bearish environment. Support in the form of the trendline and the 100-period moving average at $1,940 - $1,944. A clear break of this level could bring about further selling in the markets and drag gold down to $1,806 in the medium term. Toward the upside, if the support level can hold, tough resistance sits at $1,982. A break above here could then see gold move towards $1,992 and then $2,000. Further upside then targets $2,082.
Given the above information, gold is in a very neutral position right now and provides possible opportunities for a short on a breakdown in price around $40, but then a good retracement back up to $,1980 - $2,000, which is also $40, if trendline support can hold. Watching the US dollar value is also important as a sharp move in the currency could result in either of these scenarios playing out.

Tradable assets:
Min.Deposit:
Max Leverage:
FCA:

Rating:


