Test- FTSE 100 Kicks Off August on a High as BP and Senior Lead Market Momentum
$11
10 Oct 2025, 13:13
Neutral
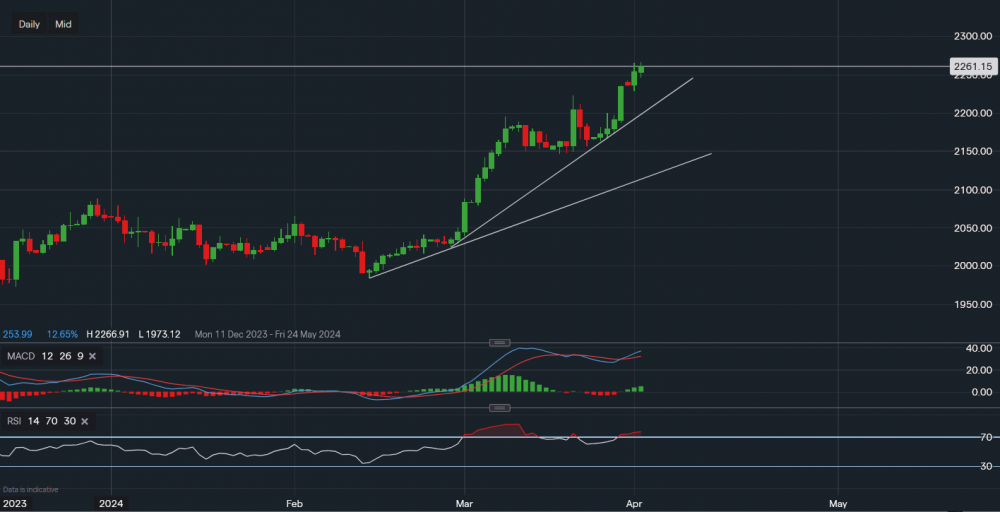
Chart & Data from IG
Taking a look at gold as the ‘safe-haven’ asset class continues to rise from support on momentum. However, with the rising dollar, some concerns are now arising for a potential cooling period. Currently, gold is trading at around $2,261 an ounce. As there is no viable resistance levels with the marketing sitting at all-time highs, traders/investors can only target psychological levels. In this instance, the next psychological target is $2,300. Towards the downside, there are various levels for the bulls. The first support reads $2,228 followed by $2,217, which sits along the upper trendline. A break below the upper trendline would then increase the likelihood of a further sell-off towards $2,170-$2,180, and then maybe even as low as $2,150. A pullback towards around $2,150 would equate to an almost 5% decline from the current level, bringing the price of gold closer to the second trendline of support as shown on the chart. Looking at the technical indicators, they are still rather positive with the MACD rising and the RSI reading 77. However, the RSI is now suggesting that the market is overbought and this is also seen in other timeframes. This doesn’t necessarily mean that the market will undergo a decline anytime soon, but it does enhance the likelihood of a pullback of some sort. The size should not be determined simply by technical indicators.

Tradable assets:
Min.Deposit:
Max Leverage:
FCA:

Rating:


