Test- FTSE 100 Kicks Off August on a High as BP and Senior Lead Market Momentum
$11
10 Oct 2025, 13:13
Neutral
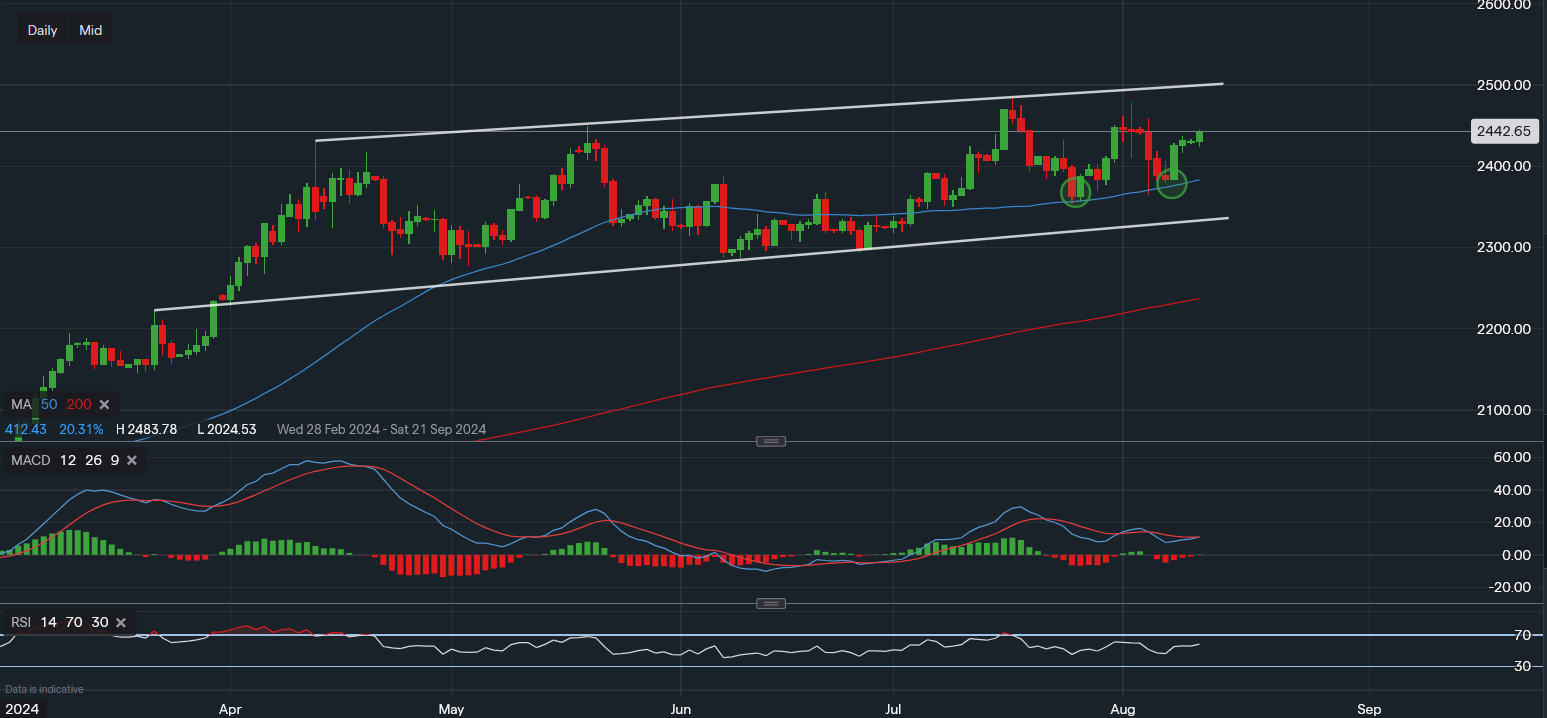
Chart & Data from IG
Gold looks like it may be ready to re-test the resistance above after being rangebound between $2,300-$2,450 since April. Currently, the precious metal is trading at around $2,442 an ounce with the daily chart suggesting that a potential W-shape pattern is underway. We can see the 50-day moving average has acted as key support here over the past couple of weeks, this has been highlighted using the green ovals on the chart. The engulfing candlestick last Thursday clearly indicates that the bulls have stepped in, perhaps creating a boost in momentum for the days to come. A move above $2,450 would certainly incentivise the buyers to push toward $2,483 (as this is the primary price level in focus for the near term). A clear break above $2,483 could pave the way for new highs in the coming weeks. Additionally, from a technical aspect, we can see the MACD is on the verge of turning positive and the RSI is creeping higher as it now reads 58. Such positioning of the indicators offers greater risk to reward for traders from a technical perspective. However, caution should remain with key inflation data upcoming this week. History shows that key economic factors can have a bigger influence on market moves than technical indicators.

Tradable assets:
Min.Deposit:
Max Leverage:
FCA:

Rating:


