Test- FTSE 100 Kicks Off August on a High as BP and Senior Lead Market Momentum
$11
10 Oct 2025, 13:13
Neutral
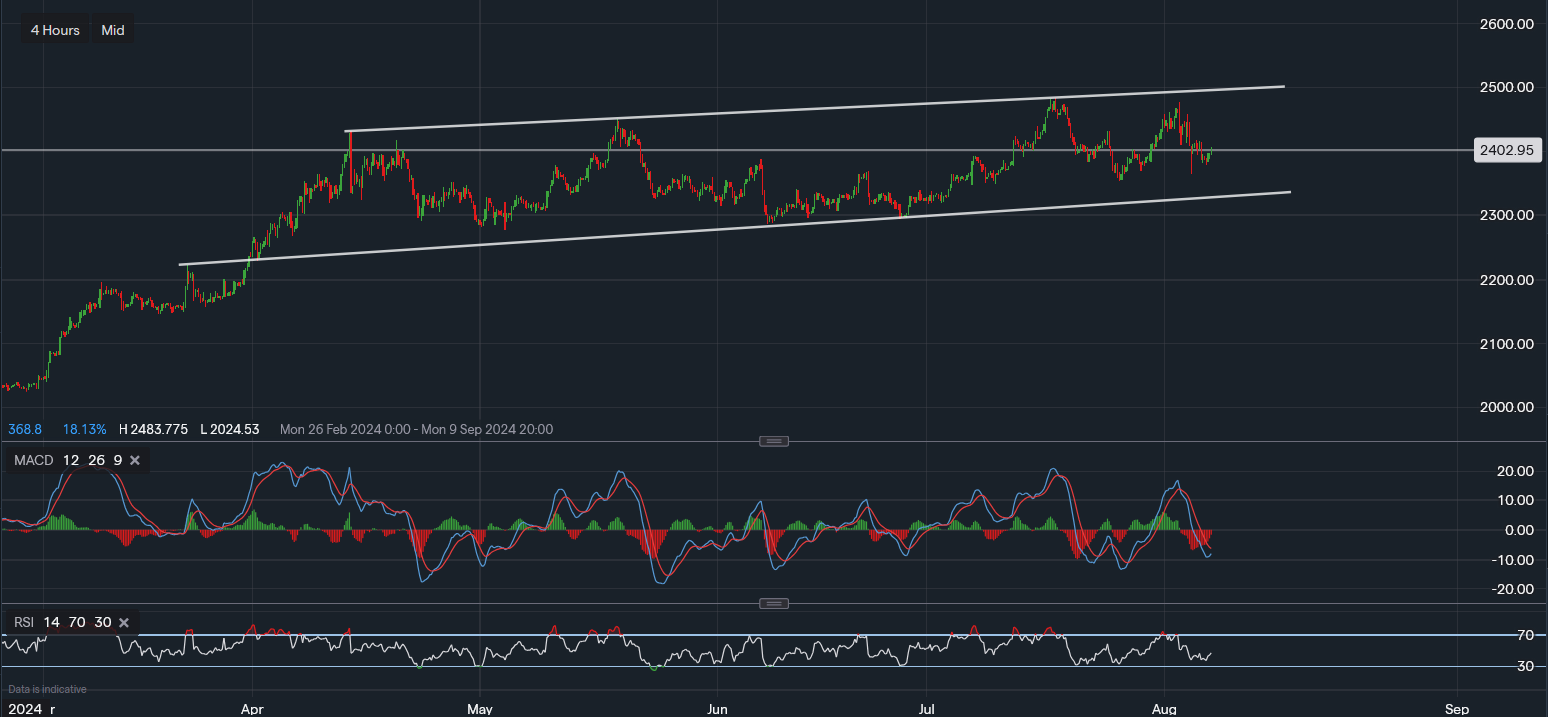
Chart & Data from IG
Gold continues to trade within the channel drawn on the 4-hourly chart with a current market price of $2,402 an ounce. The primary resistance sits along the upper trendline between $2,495-$2,500oz. The key support lies along the lower trendline reading approximately $2,330-$2,355. This interpretation is based on the current position of the market and its price as exact resistance and support levels can be difficult to determine. Zooming in for a closer look (Figure 1), near-term support for traders is around $2,378 (7th Aug low). A move below here would see traders look towards support around $2,364-$2,369 before looking lower towards $2,353 with the hope of not reaching trendline support. Towards the upside, key levels for intraday and weekly trading at $2,418 followed by $2,024 and then $2,432. From a technical aspect, the price positioning is within a rather neutral area, creating a higher risk to reward for either direction. Hence, a move either below $2,378 or above $2,424 may provide more of an incentive for traders. Looking at the technical indicators, they remain in the bearish territory. However, the MACD is starting to curve up, but caution should remain as it can just as easily touch its signal line before falling further. Nonetheless, the RSI is also edging higher as it now reads 45, potentially providing a short-term setup for the bulls.
(Figure 1)


Tradable assets:
Min.Deposit:
Max Leverage:
FCA:

Rating:


