Test- FTSE 100 Kicks Off August on a High as BP and Senior Lead Market Momentum
$11
10 Oct 2025, 13:13
Neutral
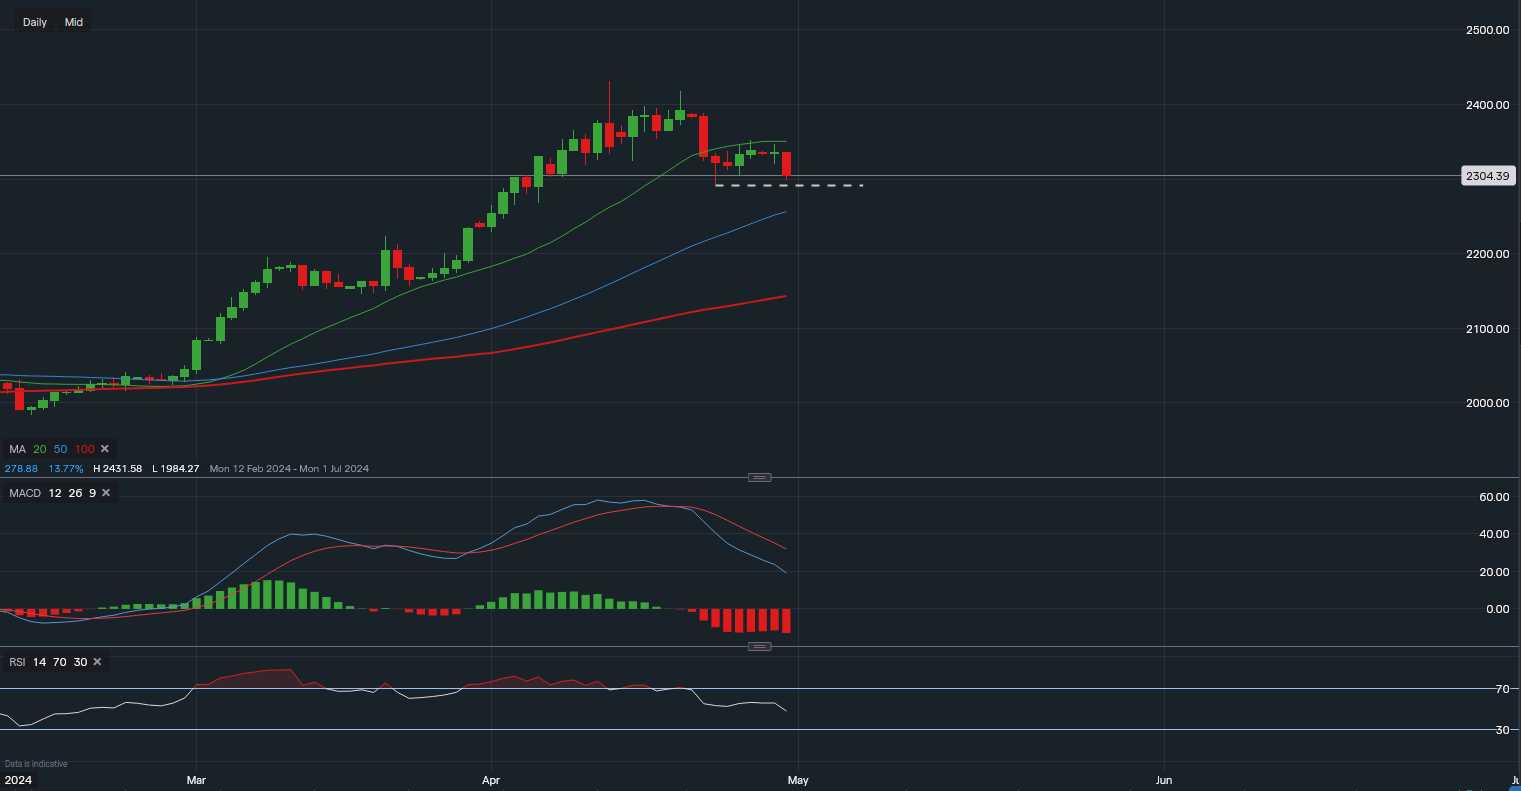
Chart & Data from IG
Gold is currently trading at around $2,304 an ounce. After rising as high as 17% so far this year, it seems like the commodity may now be undergoing a pullback due to some profit-taking as well as a firming US dollar ahead of the Fed policy meeting. Looking at this chart from a technical standpoint, we can see that gold has now broken below its 20-day moving average and heading towards the 50MA. Although, it will face an important support level first tat $2,291 (dotted trendline. A break below this support should most likely confirm a move towards the 50MA. A break below the 50MA would shift the focus towards the 100MA, but it is too early to point out any levels lower until there is a break below $2,291. The near-term bias seems to be shifting towards bearish, hence, it would be unreliable to target any resistance areas. However, if there are signs of consolidation around $2,291 then the primary resistance point would be the 20MA. Looking at the technical indicators, the MACD is negative and seems to continue that way. Additionally, the RSI is falling and also negative as it now reads 47.

Tradable assets:
Min.Deposit:
Max Leverage:
FCA:

Rating:


