Test- FTSE 100 Kicks Off August on a High as BP and Senior Lead Market Momentum
$11
10 Oct 2025, 13:13
Neutral
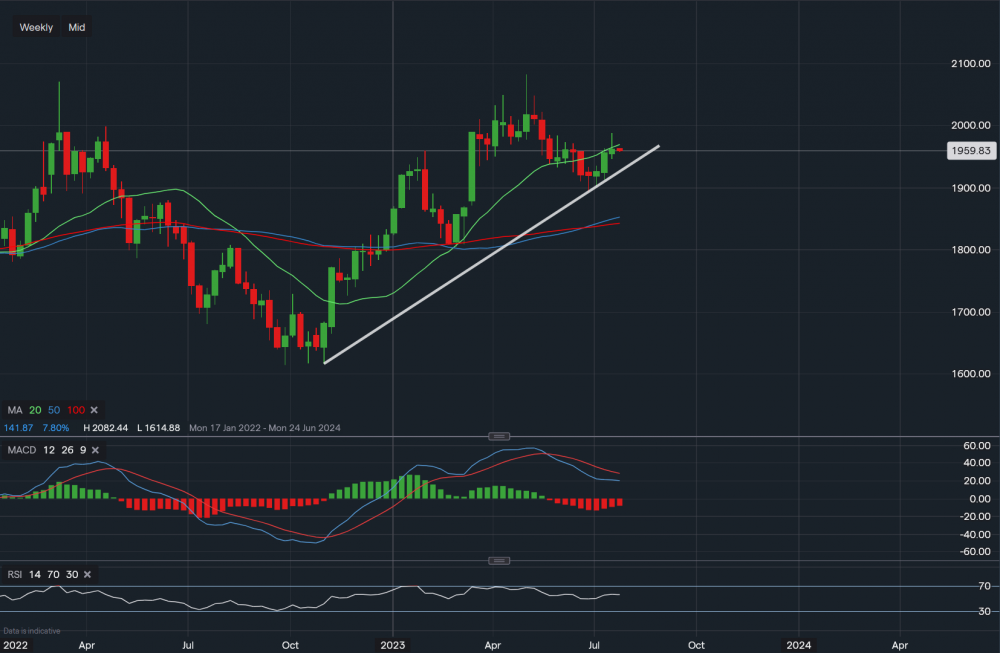
Chart & Data from IG
Taking a look at gold prior to the Federal Reserve’s monetary policy decision on Wednesday. Currently, the metal is trading at around $1,959 an ounce. Looking on the weekly interval, we can see that it is now approaching the 20-day moving average after falling below it back in June. The resistance sits at $1,969 (20-day MA). A break above it could then see a move towards $1,987, which is the key level that gold would need to overcome in order to climb higher. Towards the downside, support sits at $1,945 and then at $1,935 (along the ascending trendline). A break and close below the trendline may see a move lower towards the next key level at $1,893. Looking at the technical indicators, MACD is still negative but the RSI is now positive as it reads 57. Hence, the technical outlook is fairly neutral. There’s potential a move in either direction dependent on the outcome of the FOMC meeting.


