Test- FTSE 100 Kicks Off August on a High as BP and Senior Lead Market Momentum
$11
10 Oct 2025, 13:13
Neutral
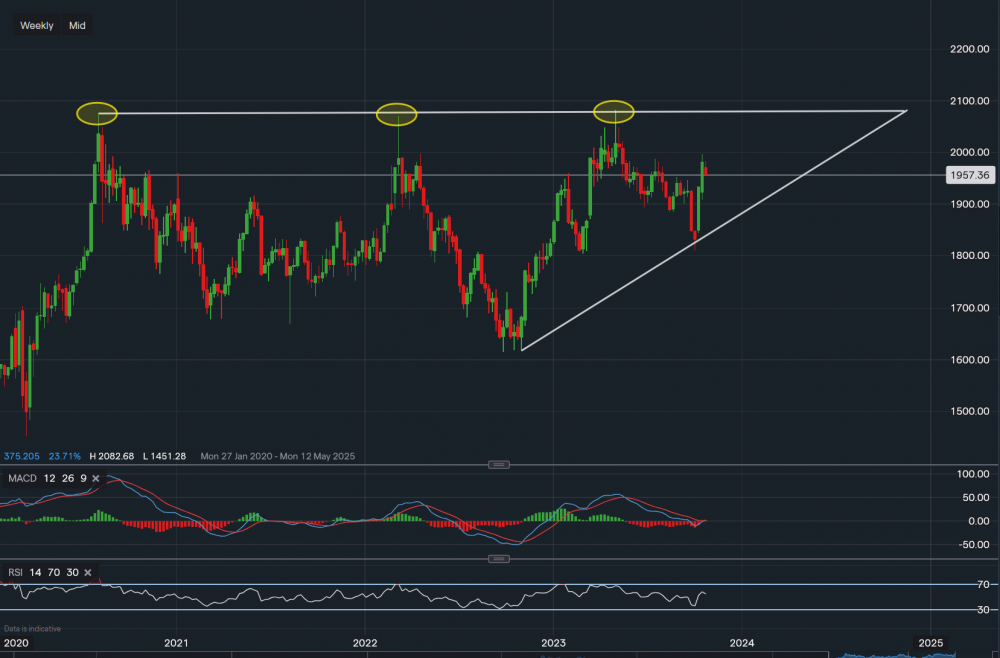
Chart & Data from IG
Gold is down over 0.7% on the day as it undergoes some profit-taking from the sharp bounce over the last couple of weeks. The bounce off the ascending trendline within the triangle drawn on the chart, suggests that perhaps the triple top formation leading to recent falls may be over as support has clearly been created. Currently, the commodity is trading at around $1,957 an ounce. Resistance sits at $1,997 (last week’s high), a break above it could see an extension beyond $2,000 an ounce towards $2,030. Nearest support now sits at $1,932 and then at $1,893. A break below $1,893 could again see a pullback towards the supportive trendline, where the support sits at $1,859. In Minipip’s opinion, the bias on gold has now shifted from bearish to neutral and the technical indicators positioning backs this view. The MACD has now turned neutral and the RSI was positive last week but has now also turned neutral as it reads 54.

Tradable assets:
Min.Deposit:
Max Leverage:
FCA:

Rating:


