Test- FTSE 100 Kicks Off August on a High as BP and Senior Lead Market Momentum
$11
10 Oct 2025, 13:13

Chart & Data from IG

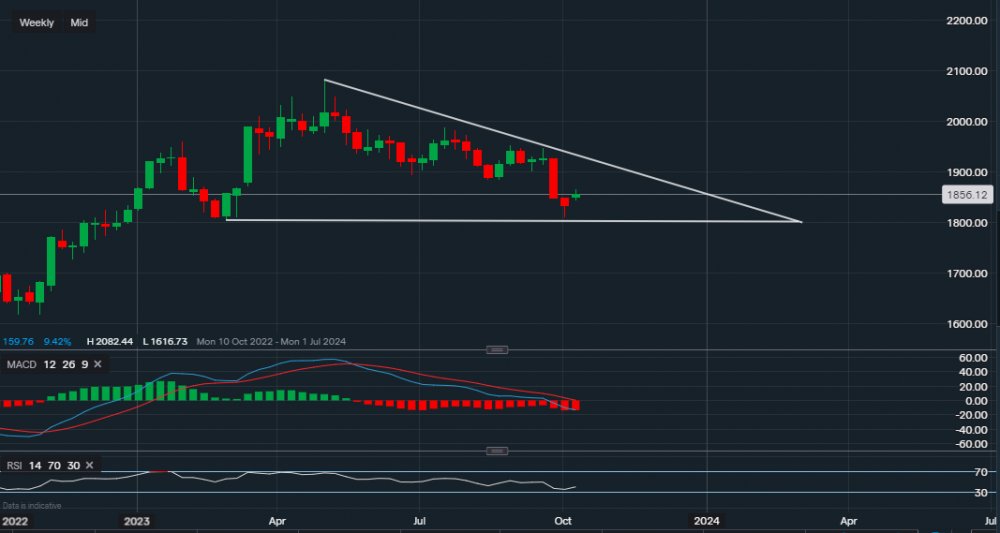
After reaching its all-time high back in May, Gold is now trading at around $1,856 an ounce. The conflict in the Middle East has given the commodity a boost, but will this last with this week’s upcoming inflation data? Looking at the chart based on a weekly timeframe, we can see a slight formation of a descending triangle. The key support sits at $1,804 (bottom trendline), the price last week reached a low of $1,810s so hasn’t tested the support as of yet. A break below this support level could see the commodity slide lower towards the range of $1,730-$1,750. On the other hand, last week’s candlestick came across as a little bullish to investors/traders, so with positive data this week we may see a rebound from gold. The resistance currently sits at $1,865 (this week’s high), then at $1,879. A move above $1,879 may see an extension testing the upper trendline, or respectively, $1,912. However, the technical indicators are still pointing towards the downside. The MACD is still negative and the RSI reads 40.