Test- FTSE 100 Kicks Off August on a High as BP and Senior Lead Market Momentum
$11
10 Oct 2025, 13:13
Neutral
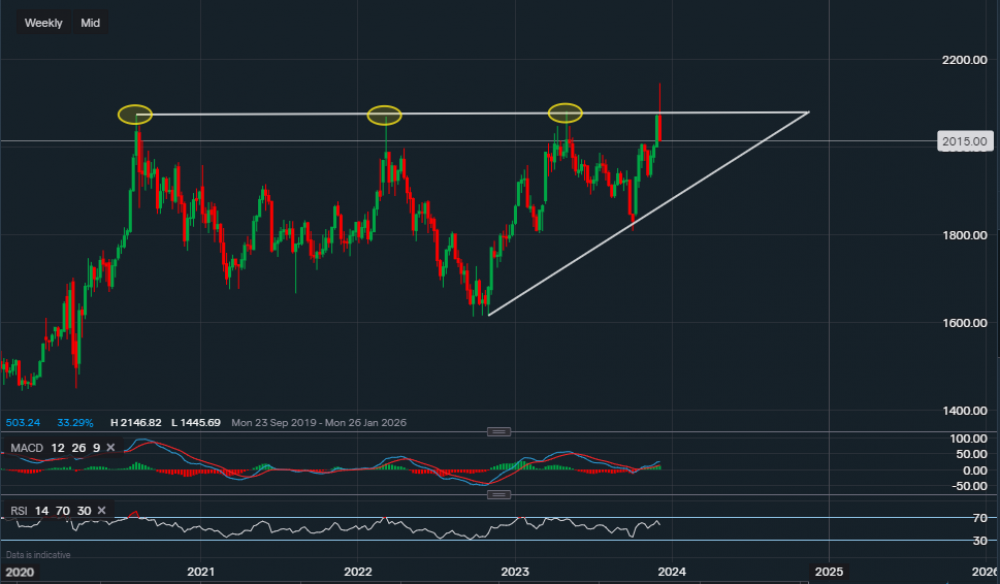
Chart & Data from IG
Gold tried to break higher once again, but the rejection has now led to a short-term selloff. The commodity is now trading at around $2,015 an ounce after reaching a new high of $2,146. This sell-off may be getting some bears excited but the bulls are still the more dominant side here, with enough support for the time being. This current retracement could just be the market taking a breather before positions are filled for an extension higher, however, resistance and support levels require some monitoring. The support here firstly sits at $2,000, which is last week’s low. A break below this level could then see a further pullback towards $1,965. If push came to shove, the bulls can also look for support along the ascending trendline which has proven its endurance so far. The main focus regarding resistance is the level of $2,082. A move and close above it would then allow the bulls to focus on the new all-time high of $2,146. Looking at the technical indicators, they are still rather positive. The MACD is still positive and so is the RSI, but it has faltered a touch. Though still reads 56.

Tradable assets:
Min.Deposit:
Max Leverage:
FCA:

Rating:


