Test- FTSE 100 Kicks Off August on a High as BP and Senior Lead Market Momentum
$11
10 Oct 2025, 13:13
Neutral
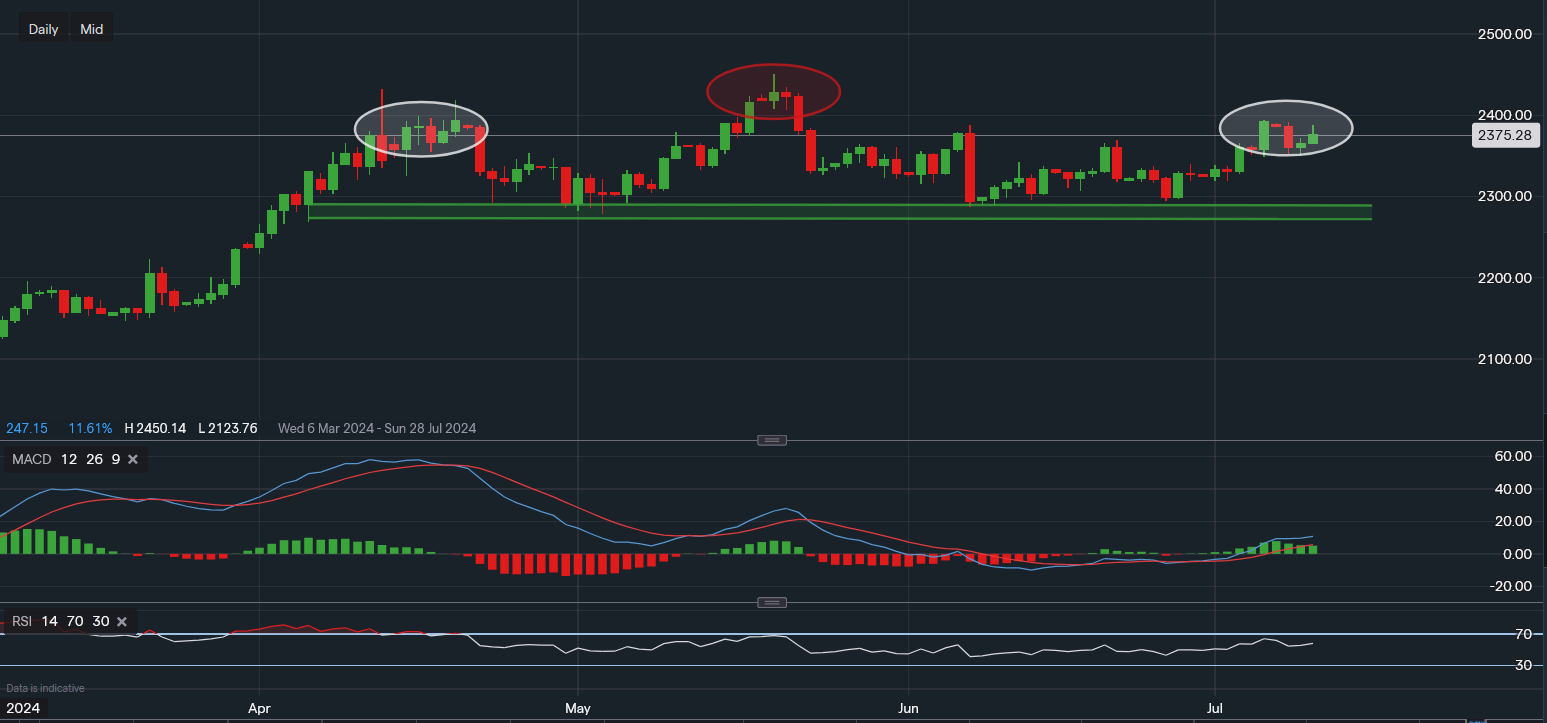
Chart & Data from IG
Taking a look at gold as a possible head and shoulders formation is arising ahead of the CPI data tomorrow. The commodity is currently trading at around $2,375 an ounce and has been rangebound since April. We have highlighted the potential head and shoulder pattern using the ovals, the red oval indicating the ‘head’. This pattern is a bearish indicator causing the price of a market to move lower, though it is not always a guarantee that a market will follow. Therefore, it is important to analysis the points of support and resistance in such scenarios to manage risk. A move above the near term resistance of $2,393 would still have to face the resistance of $2,431 to write off the possible head and shoulders pattern. In that case, the next point of resistance would be the all-time high of $2,450. A move above $2,450 would certainly incentivise the bulls to push higher to the next psychological level of $2,500. Towards the downside, near term support sits at $2,349. A break below would mean the bulls need to hold out the support base presented below (green channel). This area offers support between $2,267-$2,286. If the bears break below this area then the head and shoulders pattern would in theory be confirmed. This could lead to a possible sell-off to as low as $2,150. The technical indicators are still relatively positive, suggesting bullish momentum is still present for the time being.

Tradable assets:
Min.Deposit:
Max Leverage:
FCA:

Rating:


