Test- FTSE 100 Kicks Off August on a High as BP and Senior Lead Market Momentum
$11
10 Oct 2025, 13:13
Neutral
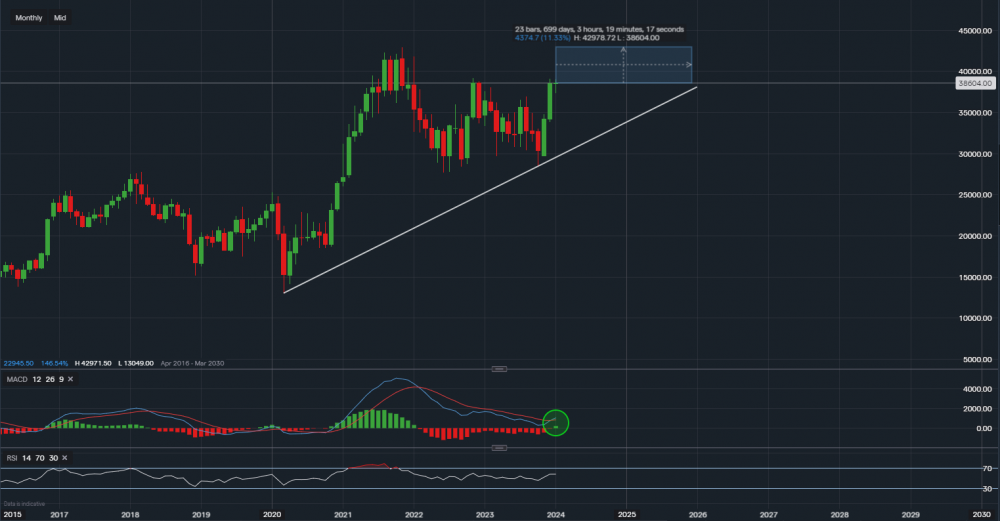
Chart & Data from IG
Taking a look at Goldman Sachs ahead of its earnings next week. Currently, the investment corporation sees its stock trading at around $386.04 a share. From a technical perspective, based on a monthly timeframe, we can see the next resistance here is the price level of $391.68. A break and close above it could then see a build of momentum from the buyers, eyeing the all-time high of $429.71. However, this a is tough resistance point, especially with the current market caution regarding the Fed and its interest rate decision. Only 60.5% of analysts now see the Fed cutting rates by 25bp in the March meeting. Therefore, it is vital to keep the support levels in mind in case of any retracement due to selling pressure. The first support to bear in mind is January’s low of $373.44. A dip below this level may then see a slide lower towards $361.94 and maybe even $349.04. However, if we take a closer look and head over to the technical indicators, they are rather positive compared to 2023. The MACD has just turned positive and is above the zero line and the RSI is positive as it reads 58. The ascending trendline, which dates back to March of 2020, also offers support.
Looking at the weekly chart, the outlook is pretty similar. The MACD is strongly positive with the RSI reading 65 (also positive), and the resistance is highlighted by the red oval. As mentioned above, a close above this resistance would, in theory, be a bullish indication and may see the price edge toward its all-time highs (green dotted trendline). The earnings next week will offer more guidance for the mid-long term outlook.

(Chart & Data from IG)

Tradable assets:
Min.Deposit:
Max Leverage:
FCA:

Rating:


