Test- FTSE 100 Kicks Off August on a High as BP and Senior Lead Market Momentum
$11
10 Oct 2025, 13:13
Neutral
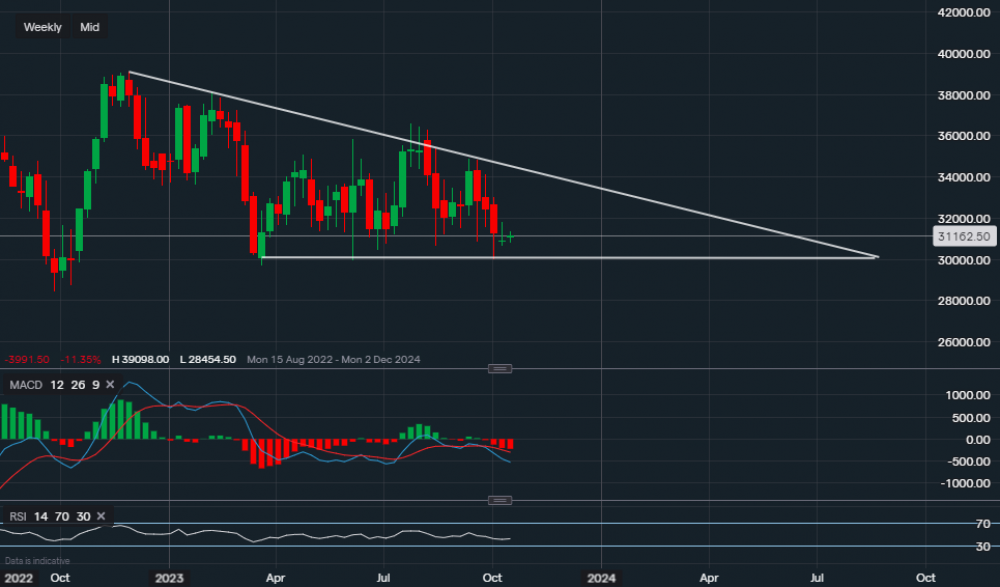
Chart & Data from IG
Looking at Goldman Sachs ahead of its earnings release tomorrow, we can see that its stock is trading at around $311.62 a share. The price has been moving sideways for quite some time now and this is more visible on the weekly timeframe. It could be argued that a descending triangle pattern is undergoing a formation, however, with the upcoming earnings that could change. After clearly establishing the support and resistance zones between March and now, the price has once again reached the support zone. The base support reads $296.82, which is highlighted by the horizontal trendline of the triangle. A break below it would send a bearish signal and could cause some concern amongst investors, although it would still have support below at $284.54 followed by $277.16. On the other hand, better-than-expected results may spark some optimism. Therefore, looking towards the upside, we can see resistance at $318.13 then at $329.78 and then at $335.89. A move above $335.89 could lead to a breakout attempt out of the triangle to the upside. But, we are nowhere near that at the moment, which is backed by the technical indicators. The MACD has turned negative once again and the RSI indicates similar as it reads 42.

Tradable assets:
Min.Deposit:
Max Leverage:
FCA:

Rating:


