Test- FTSE 100 Kicks Off August on a High as BP and Senior Lead Market Momentum
$11
10 Oct 2025, 13:13
Neutral
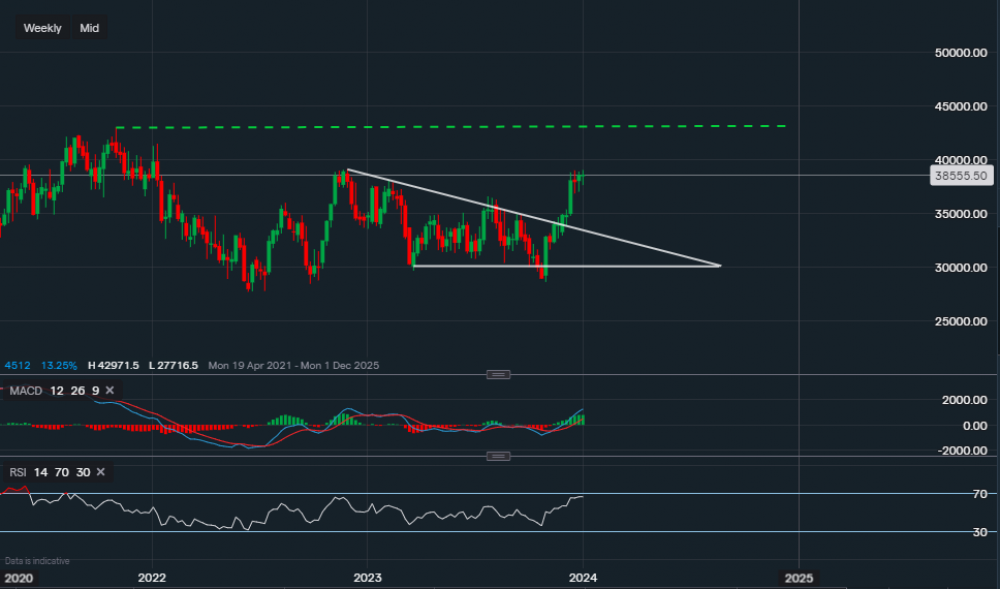
Chart & Data from IG
Taking a look at Goldman Sachs as it has 11 ‘buy’ with 5 ‘hold’ ratings for 2024. Currently, its shares are trading at around $385.55 a share. We can see that after moving sideways pretty much all of 2023, towards the end of the year, it broke out of the descending triangle and closed near 2022’s resistance of $390.98. So far, the stock has struggled to move above this resistance, proving to be a key level here. A break and close above it would suggest that further upside is possible, with the next key resistance then of $429.71 (green trendline - also the all-time high). The support here now is $368.58 with further support sitting at $349.04. A break and close below $349.04 may suggest that a pullback towards the descending trendline of the triangle is likely, as the trendline would then act as the key support. Looking at the technical indicators, they are currently bullish. The MACD is pretty positive with the RSI reading 66 and not yet ‘overbought’.

Tradable assets:
Min.Deposit:
Max Leverage:
FCA:

Rating:


