Test- FTSE 100 Kicks Off August on a High as BP and Senior Lead Market Momentum
$11
10 Oct 2025, 13:13
Neutral
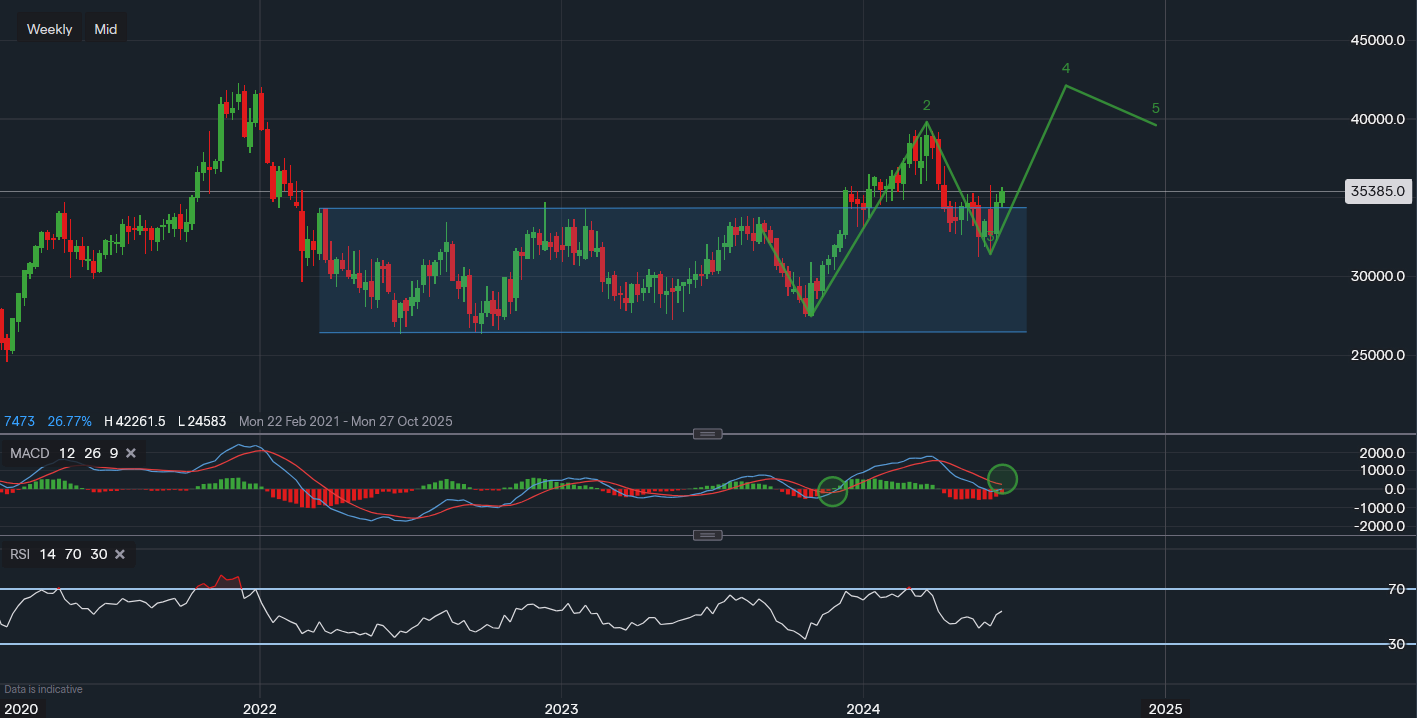
Chart & Data from IG
A potential setup here on the weekly chart for Home Depot to test the all-time highs in the midterm. Currently, its share price floats around $353.85 a share. We can see the breakout that occurred earlier in January after a 21-month period of moving sideways. What seemed to have happened following the breakout was a resistance to support flip, the previous resistance zone of $325-$340 turned into support, and the price retraced for a test. It’s looking like consolidation took place with now a potential leg higher underway. A move above $364.83 would increase the likelihood of this move with the next resistance then at $397.86 (March high). A break below the newly created higher low of $312.24 would suggest that it was a false breakout and momentum has faded, potentially forcing a sell-off towards the base support of $263- $274. The technical indicators are starting to look more positive, the MACD is beginning to curve up as it has done previously leading to the breakout. Additionally, the RSI is rising once again as it now reads 53.

Tradable assets:
Min.Deposit:
Max Leverage:
FCA:

Rating:


