Test- FTSE 100 Kicks Off August on a High as BP and Senior Lead Market Momentum
$11
10 Oct 2025, 13:13
Neutral
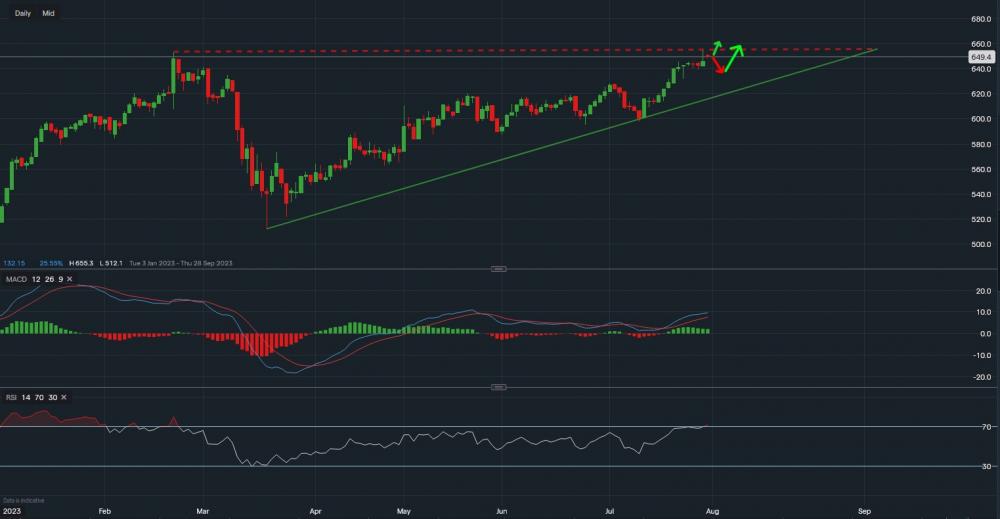
Chart & Data from IG
HSBC has had a brilliant run since mid-March, up 19% YTD. The price of its stock has now approached a key resistance zone, which is highlighted by the dotted trendline, or alternatively 653p. We can see that on Friday the price attempted to break through this resistance zone reaching a high of 655p, however, it soon retraced closing below it at 645p. Will we see another attempt tomorrow? The earnings may provide the momentum for a push higher towards 670p a share (mid-term), a level last seen in July 2019. The technical indicators are both positive, with an RSI reading of 71. The RSI does suggest that the stock is a little oversold, hence, traders/investors should not become confused by any short-term pullbacks on positive earnings. Pullbacks can occur before moving higher, this is shown on the chart by the drawn arrows, which highlight the two possibilities. Though, this is not guaranteed by any means as a negative report may see the price decline. The support sits at 640p then at 632p, a break below 632p may see a retracement to as low as 621p (green trendline). The longer-term bias remains bullish.


