Test- FTSE 100 Kicks Off August on a High as BP and Senior Lead Market Momentum
$11
10 Oct 2025, 13:13
Neutral
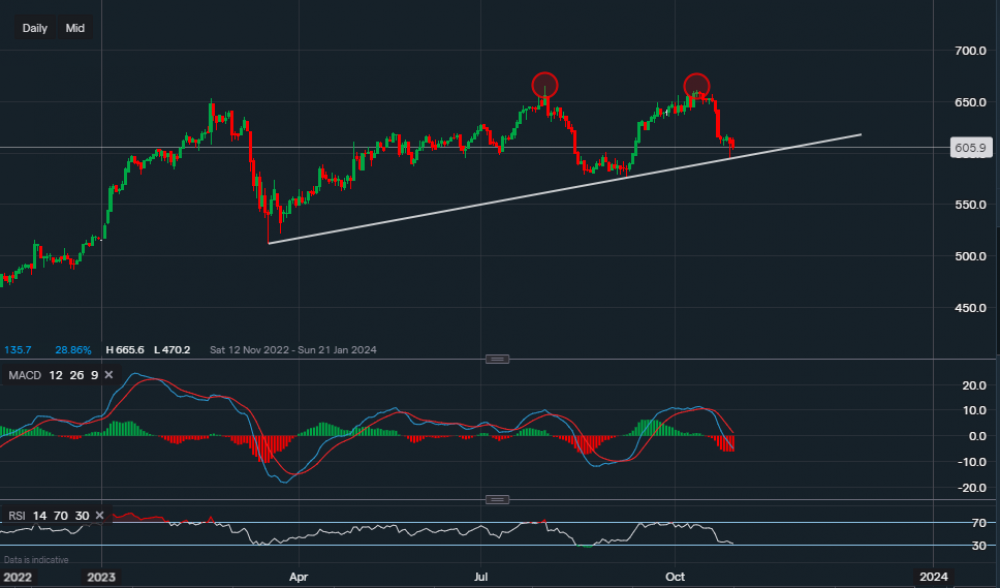
Chart & Data from IG
HSBC is one of the last ones of the UK banks to report earnings on Monday. The UK banks have taken some pretty hard declines in recent weeks/days, with NatWest falling 13% today alone and dragging the rest with it. Currently, HSBC’s shares are trading at around 605p a share. From a technical perspective, the support remains in place as the price hasn’t broken through the trendline. Although, the support was tested yesterday but the stock finished the session higher. A break below the trendline support of 603p could see the price head lower towards the support of 576p (September’s low). We can also see that the price earlier in the month did try to break higher, but the resistance of 665p proved its resilience. As it could be argued that a double top has now formed, this is highlighted by the red ovals. A double top is a bearish indication, usually suggesting that the momentum is running out of steam and a turnaround is possible. However, this is of course not guaranteed. The resistance at the time sits at 618p, a move and close above may see an extension towards 628p. The bias here is now bearish and perhaps the earnings will influence this bias, either strengthen it or neutralise the outlook.

Tradable assets:
Min.Deposit:
Max Leverage:
FCA:

Rating:


