Test- FTSE 100 Kicks Off August on a High as BP and Senior Lead Market Momentum
$11
10 Oct 2025, 13:13
Neutral
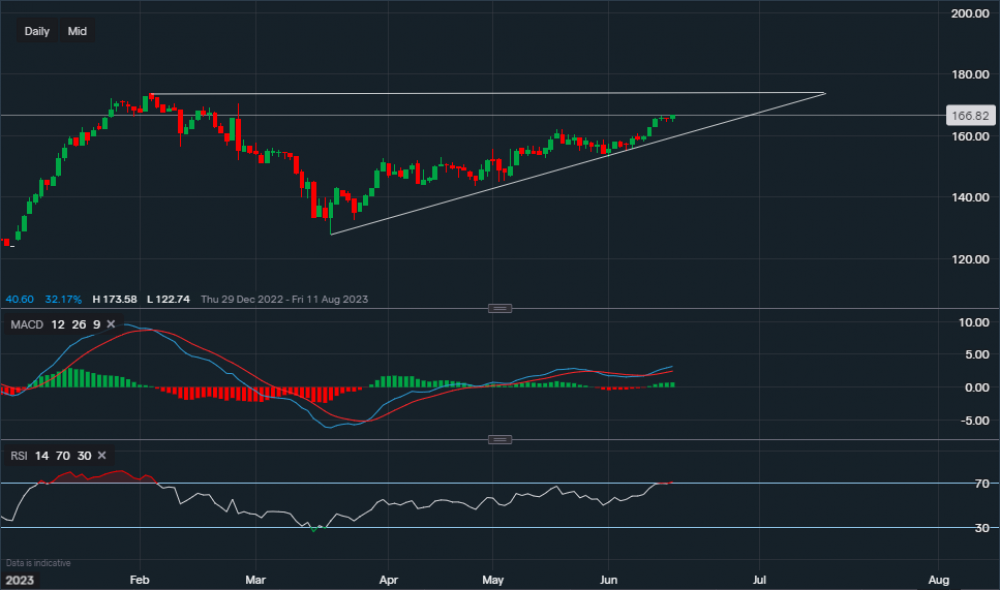
Chart & Data from IG
Taking a look at IAG as it is still well and truly within this ascending triangle on the daily timeframe. Currently, its stock is trading at around 166p a share, with the next level of resistance sitting at 169p then at 170p and then the key level at 173p (upper trendline). A break and close above 173p may see a stretch towards 180p a share, although this is more likely in the mid-term. Below we can see that there is plenty of support in case any retracements occur, with the first minor level sitting at 164p followed by support along the ascending trendline of 160p. A move below the trendline may lead to a further retracement towards 152p. However, the current bias remains bullish. Looking at the technical indicators, MACD remains positive and so is the RSI as it reads 71. Though the RSI has just entered ‘overbought’ territory.

Tradable assets:
Min.Deposit:
Max Leverage:
FCA:

Rating:


