Test- FTSE 100 Kicks Off August on a High as BP and Senior Lead Market Momentum
$11
10 Oct 2025, 13:13
Neutral
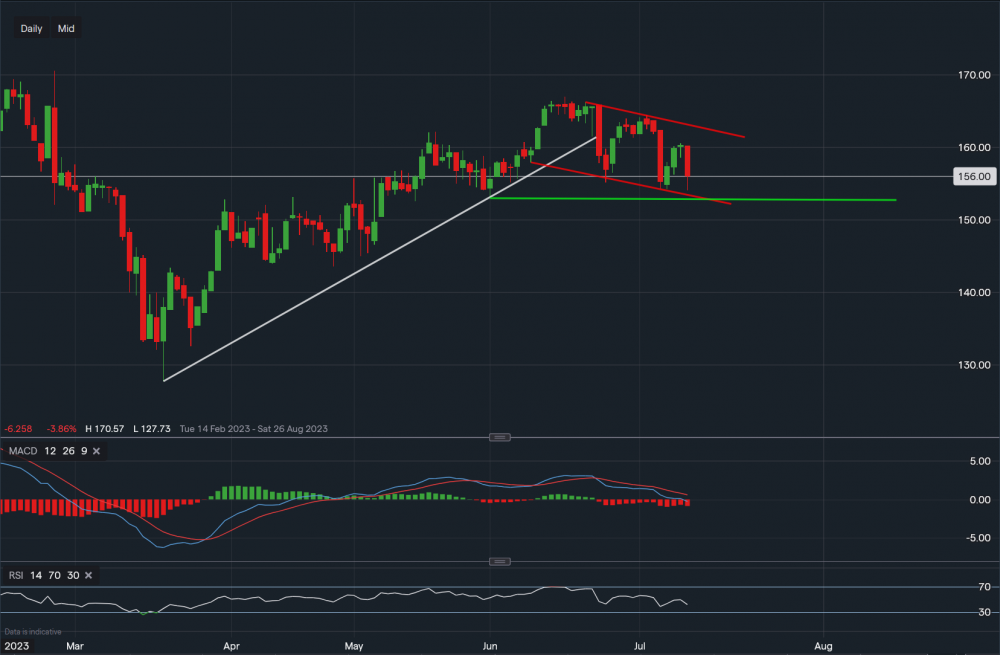
Chart & Data from IG
Taking a look at IAG as we have had some clear downside over the last couple of weeks. Currently trading at around 156p a share, from a technical outlook, we can see that the price is now trading within the channel drawn on the chart (red trendlines). It seems like the bullish trend has been halted and a short-term bearish trend has begun, a break below the white ascending trendline was an indication. However, this can also be called a retracement due to profit-taking. The support now sits at 154p (lower red trendline) and then at 152p (green trendline). A break below the green trendline could see a move lower towards 150p and maybe even 146p. A move towards 146p could suggest that a bearish trend is overpowering the current bullish trend. On the other hand, as the longer-term bias remains bullish, we now have resistance at 158p then at 160p and then at 161p (along the upper red trendline). A break and close above the channel may suggest that the bullish trend is back in motion, with the targets then of 164p followed by 166p. Looking at the technical indicators, MACD is negative on the daily timeframe and so is the RSI as it now reads 42. Though, this is not a clear indication that the price will continue falling. Note: investors should be cautious of investing in IAG as even though travel demand has picked up and is projected to continue over the summer, the British economy is suffering at the moment. With inflation still hotter than expected, interest rates are rising and the economy is on the brink again of recession. This may have a negative impact on UK stocks.

Tradable assets:
Min.Deposit:
Max Leverage:
FCA:

Rating:


