Test- FTSE 100 Kicks Off August on a High as BP and Senior Lead Market Momentum
$11
10 Oct 2025, 13:13
Neutral
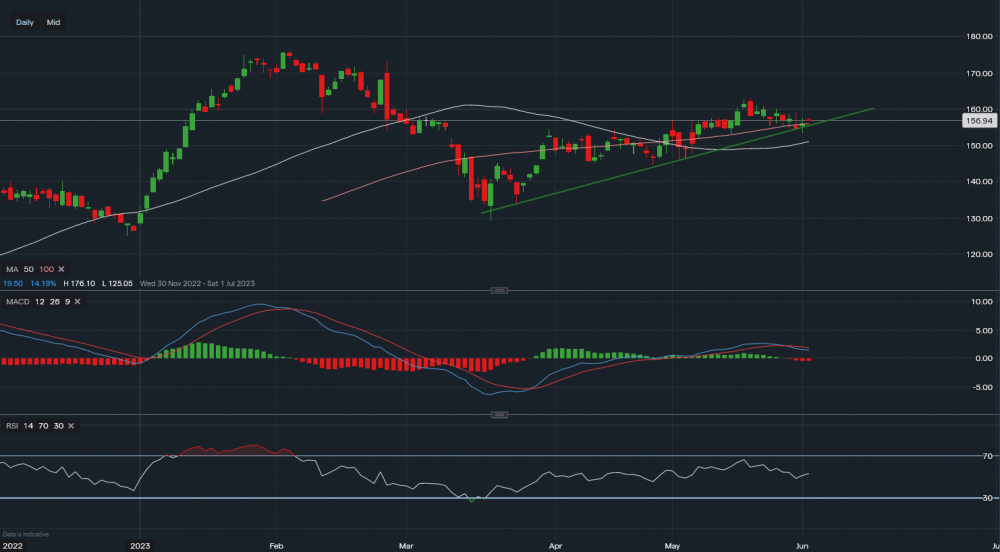
IAG - Chart & Data from IG
IAG shares continue to trend higher after hitting weekly highs at £1.6300, since then the stock has retraced lower back to trendline support at around £1.5450. The 50 & 100-period moving averages are also now starting to move higher with an RSI reading of 54. MACD is currently negative however therefore some further consolidation could be in store before IAG tries to move higher.
Towards the downside, if trendline support fails to hold at £1.55 then the 50 SMA, would be the next level of support at around £1.51. A further slide below here could then see IAG fall to £1.45. Towards the upside, IAG will face minor resistance at £1.6298. A break above here could then see the stock move higher towards 2023 high at £1.73. A further break above here then targets £2.00. According to tipranks IAG has an average analyst rating of £1.93 with a 'modest buy' rating.
PLEASE NOTE THIS IS NOT ADVICE.

Tradable assets:
Min.Deposit:
Max Leverage:
FCA:

Rating:


