Test- FTSE 100 Kicks Off August on a High as BP and Senior Lead Market Momentum
$11
10 Oct 2025, 13:13
Neutral
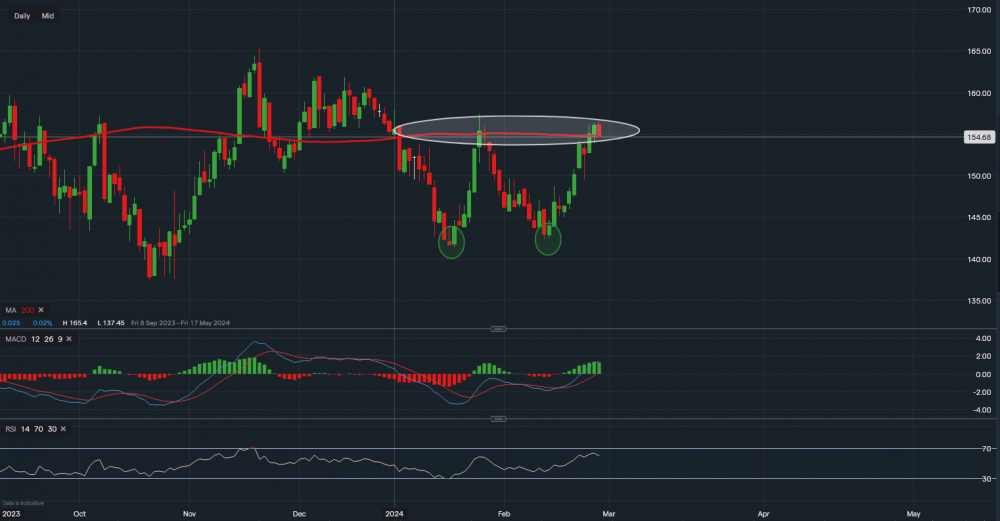
Chart & Data from IG
Taking a look at IAG ahead of its earnings tomorrow, currently its shares are trading at around 154p a share. We can see that the price has approached the resistance along the 200-day moving average once again, it has re-tested the support around 141p-142p before moving higher (highlighted by green ovals). The primary resistance in focus is the level of 157p, if this can be broken the path towards 162p and then 165p would then certainly become likely. However, if the earnings see the price close below the 200MA then we could see yet another decline towards that support of 141p-142p. The technical indicators are more towards the bullish bias, with the MACD now clearly positive and the volume enlarged. The RSI is slightly sliding but still positive as it reads 60. However, we have seen in the past that these indicators can easily falter and should not be used alone for the determination of future price movements. Additionally, they are also lagging indicators, meaning that trends can be in the process of forming before the indicator has time to react accordingly.

Tradable assets:
Min.Deposit:
Max Leverage:
FCA:

Rating:


