Test- FTSE 100 Kicks Off August on a High as BP and Senior Lead Market Momentum
$11
10 Oct 2025, 13:13
Neutral
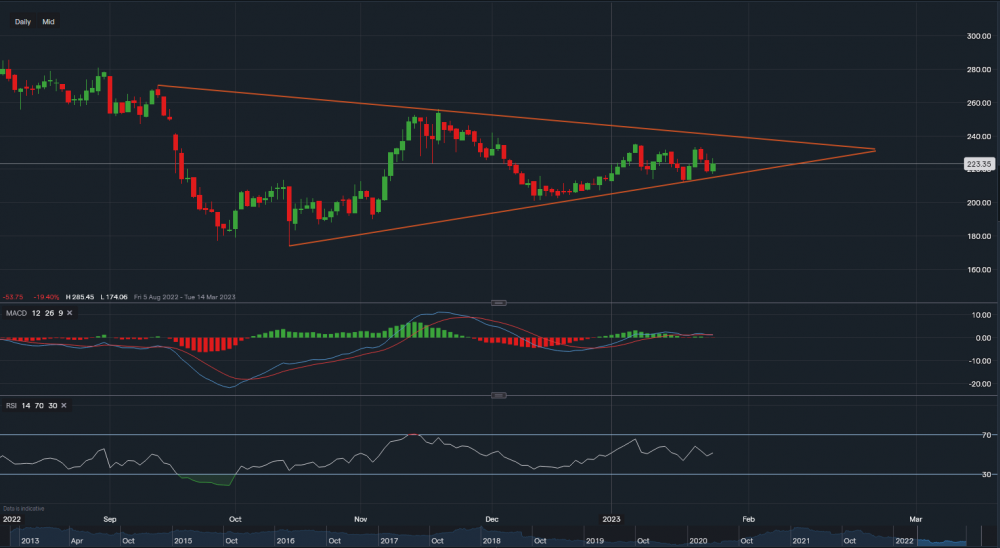
IDS - Chart & Data from IG
From a technical aspect, IDS’ shares are currently trading at around 223.35p a share. We can see a slight formation of a symmetrical triangle on the daily timeframe, a symmetrical triangle usually suggests a ‘bullish’ bias. Therefore towards the upside, resistance sits at 229.25p then at 231.65 then at 223.50. A break above 223.50 could see its price face the key resistance of 239p, which corresponds with the upper trendline of the triangle. On the other hand, towards the downside, support levels sit at 221.10p then at 218.48 then at 217.40. A break below 217.40 could see the price slip below the lower trendline, sliding towards 200-201p. Returning to a bearish outlook. Looking at the technical indicators, MACD is currently neutral and so is RSI as it reads 52.

Tradable assets:
Min.Deposit:
Max Leverage:
FCA:

Rating:


