Test- FTSE 100 Kicks Off August on a High as BP and Senior Lead Market Momentum
$11
10 Oct 2025, 13:13
Neutral
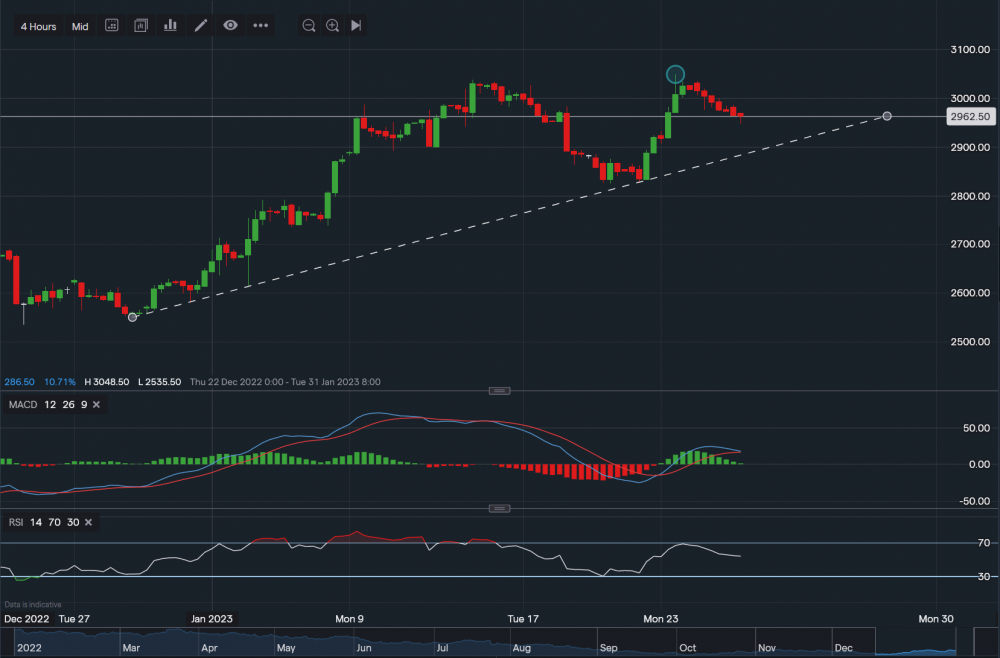
Intel - Chart & Data from IG
Technicals
From a technical perspective, Intel’s stock is currently trading at around $29.62 a share. We can see that on the 12th of January, it set a new resistance level of $30.37, the momentum then fizzled away as the technical indicators suggested that the stock was ‘overbought’. However, a new level of support was established at $28.25 (along the dotted trendline). This then led to a regaining of momentum, which pushed the price above the initial resistance to create a new resistance point of $30.48 on the 23rd of Jan (blue oval). This pattern may repeat itself in order to re-test the resistance formed on the 23rd of January. Therefore, we could see a pullback towards the trendline support, around the $29.00 level, before a bounce higher. Looking at the technical indicators, MACD is turning negative and RSI is neutral, but RSI is faltering as it reads 52. Note to investors: a key factor to watch, that could influence the price of this stock, is the quarterly earnings report which is due tomorrow (25/01/23). Intel is expected to report earnings of $0.22 on revenue of $14.6bn.

Tradable assets:
Min.Deposit:
Max Leverage:
FCA:

Rating:


