Test- FTSE 100 Kicks Off August on a High as BP and Senior Lead Market Momentum
$11
10 Oct 2025, 13:13
Neutral
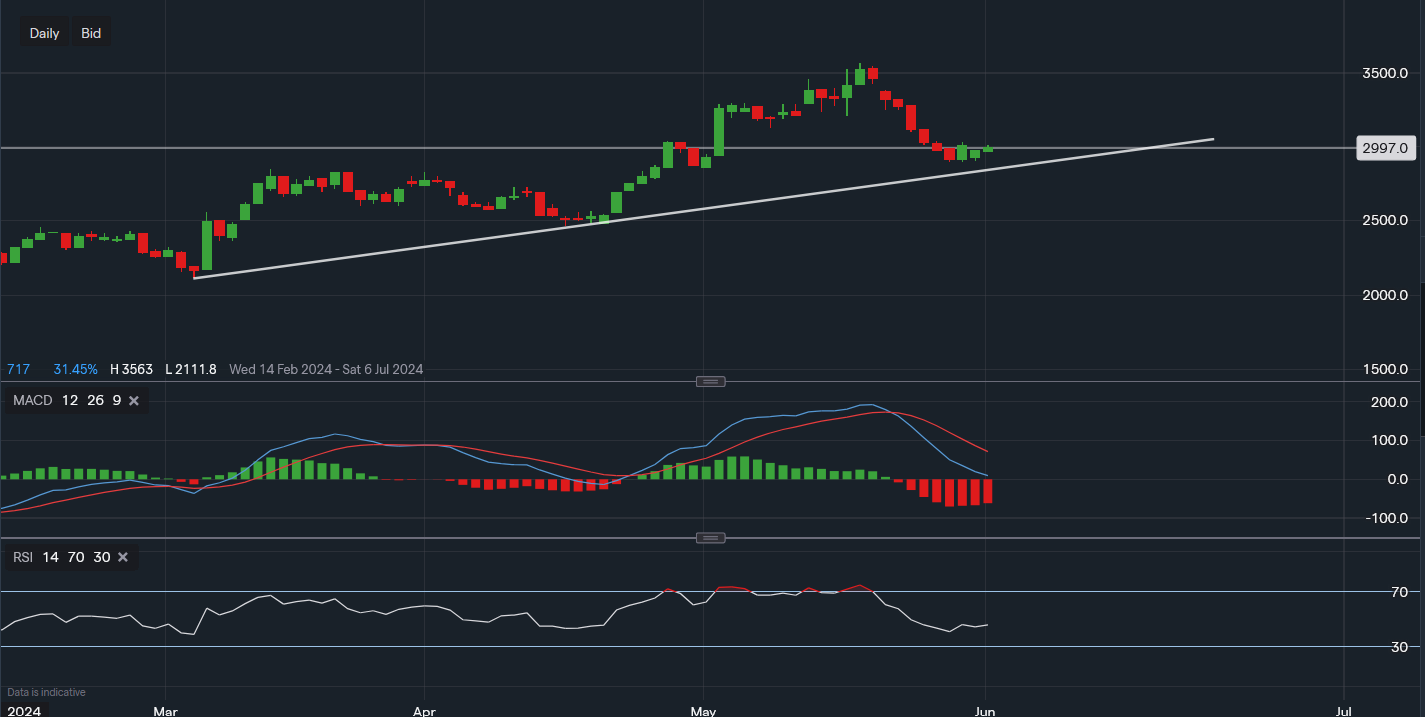
Chart & Data from IG
Taking a look at JD.com as its share price has approached the trendline support, which so far has been acting as the base for higher highs followed by higher lows. Currently, its stock is trading at around $29.97 a share in the pre-market. The daily timeframe shows us that Thursday and Friday closed in the green, perhaps early consolidation as well as maybe a new low being formed. If the trend is to continue, the level of resistance in focus will be $30.41. A break above this level would then see $32.98 in the limelight before eyeing up the highs of the year. The primary support is now along the trendline reading $28.47, as a break below could see a slide towards $24.62 (April low). Looking at the technical indicators, the MACD is still negative but as we can see it was also negative in April before eventually turning positive for that leg higher. Technicals are lagging indicators, more of the time than not. Hence, they should not be used alone to determine price direction. Nonetheless, the RSI has now turned neutral from the negative position as it reads 46.

Tradable assets:
Min.Deposit:
Max Leverage:
FCA:

Rating:


