Test- FTSE 100 Kicks Off August on a High as BP and Senior Lead Market Momentum
$11
10 Oct 2025, 13:13
Neutral
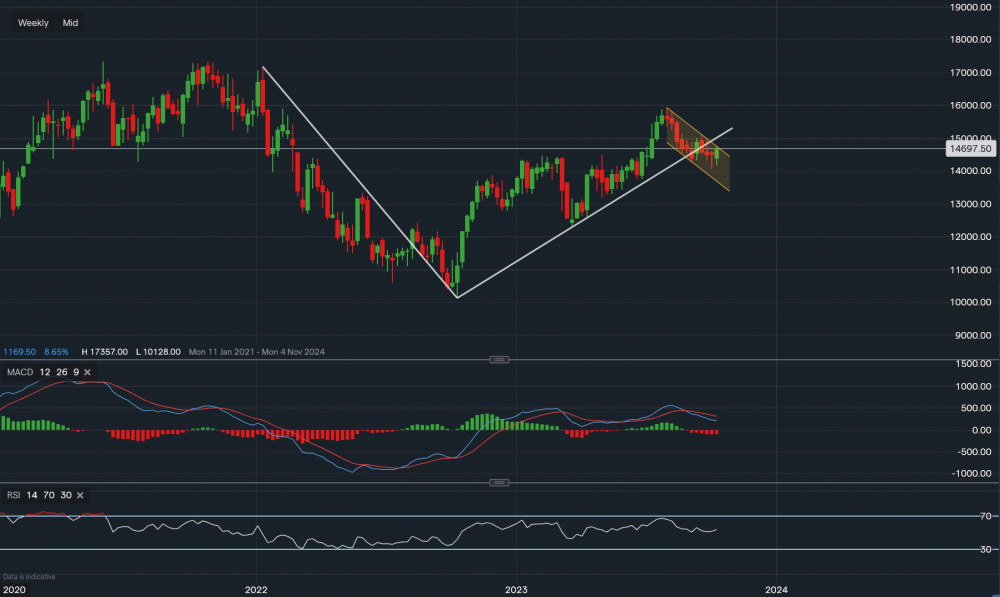
Chart & Data from IG
JPMorgan’s stock is trading at around $146.97 a share. Looking at the chart from a technical outlook, based on the weekly timeframe, we can see that the bullish trend dating back to October of last year was broken on the week commencing the 4th of September. The price did try to climb back above the trendline, suggesting a bear trap, but in fact, it was a bull trap. This has now created a short-term bearish trend. However, last week’s candlestick closed as a hammer doji, creating questions about the near-term direction of this stock. If the price breaks out of the bearish channel drawn on the chart, we could see an extension in the following week with a close back above the trendline. The resistance within the channel reads $147.69, which is so far, this week’s high. The challenging resistance after that would be $150.61. Support for the time being sits at $142.65 and then at $140.67 (last week’s low). A move below $140.67 could see a slide lower towards the lower end of the channel which reads $135.67. The technical indicators are mixed right now, with the MACD negative but the RSI reading 53 (neutral).

Tradable assets:
Min.Deposit:
Max Leverage:
FCA:

Rating:


