Test- FTSE 100 Kicks Off August on a High as BP and Senior Lead Market Momentum
$11
10 Oct 2025, 13:13
Neutral
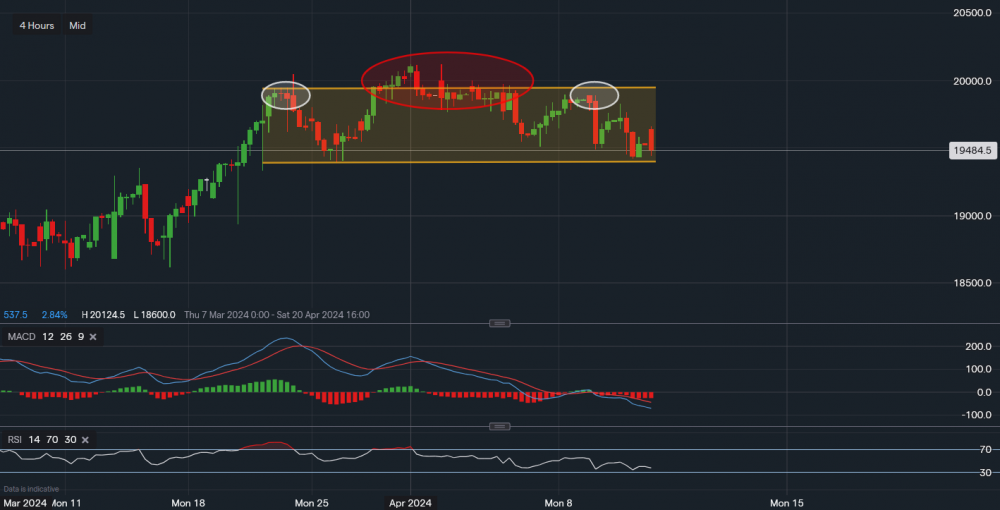
Chart & Data from IG
Taking a look at JPM as the major US banks kickstart the earnings season tomorrow. The bank’s shares are trading at around $194.84 in the pre-market session. Looking at the chart based on the 4-hour interval, it seems like a potential head and shoulders formation is underway. The shoulders are highlighted by the white ovals whereas the head is within the red oval. The resistance is the all-time high of $201.23, the stock tried to overcome this level on the 2nd of April but was rejected. This has led to the recent sell-off towards current levels. A head and shoulder formation tends to be a bearish indication, however with the earnings for Q1 due tomorrow, the market can be deceiving. The support at the centre of attention is now the level of $193.93, as a break below it may lead to a sell-off towards $186-$187. Towards the upside, the resistance reads $198.30 then $198.95, and then the upper trendline of the channel, which reads $199.50. If we take the technical indicators into consideration, they point towards further weakness. But, as they are lagging indicators and can sometimes have no influence on volatility during earnings, they cannot be used as a guide alone for price determinations.

Tradable assets:
Min.Deposit:
Max Leverage:
FCA:

Rating:


