Test- FTSE 100 Kicks Off August on a High as BP and Senior Lead Market Momentum
$11
10 Oct 2025, 13:13
Neutral
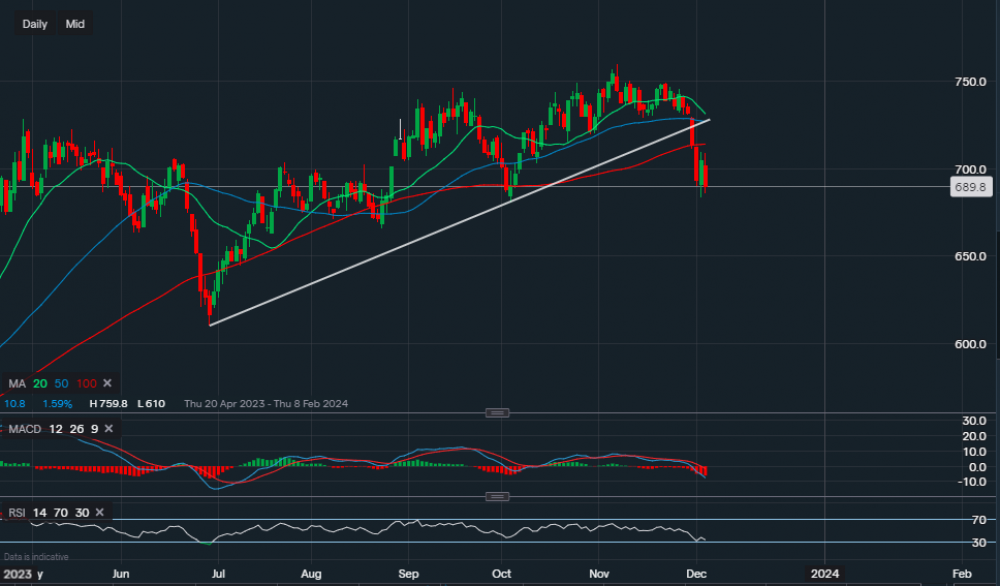
Chart & Data from IG
London sugar trading at around 689p. We can see that the commodity has now in theory broken below its supportive trendline, which is a bearish signal. The price has fallen below the 100-day moving average also suggesting a bearish shift movement. It is now approaching the support of 680p, a break below it could then see a move towards 665p. There is also minor support at 662p but a move below it would increase the likelihood of a decline towards 645p-640p. The technical indicators support the bearish bias as the MACD is negative with the MACD line below the zero line. And the RSI is also negative as it reads 33. At this moment in time, the main resistance here is along the 100-day moving average currently reading 714p. But the risk to reward for bulls is poor right now unless there are signs of consolidation around current levels.

Tradable assets:
Min.Deposit:
Max Leverage:
FCA:

Rating:


