Test- FTSE 100 Kicks Off August on a High as BP and Senior Lead Market Momentum
$11
10 Oct 2025, 13:13
Neutral
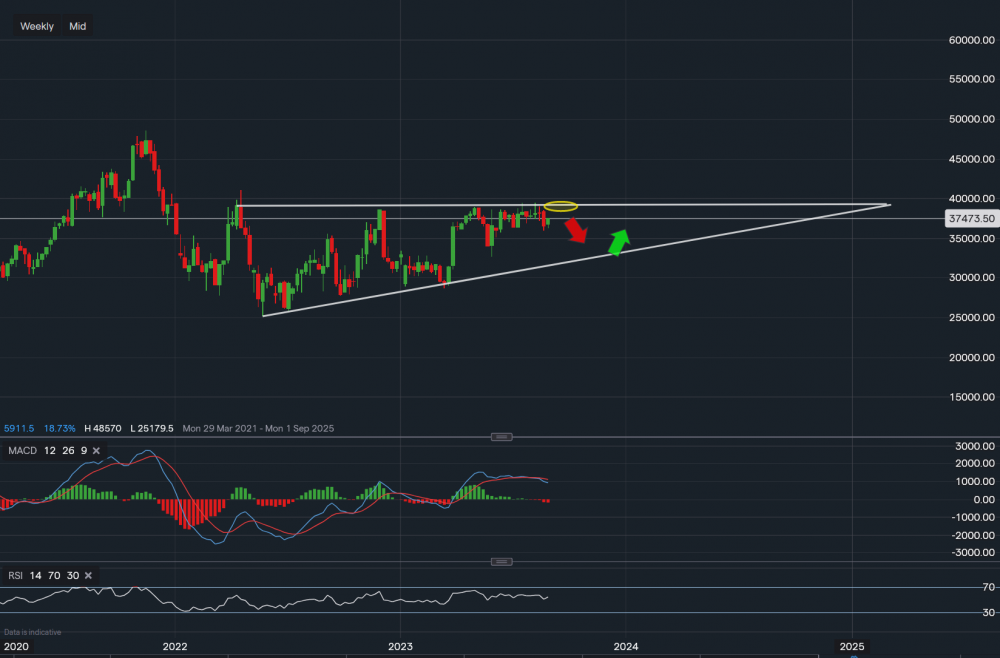
Chart & Data from IG
Taking a look at Lululemon as it is expected to report quarterly earnings tomorrow, currently, its stock price is trading at $374.73 a share. Based on the weekly timeframe, we can see the price has tried to break out of the triangle towards the upside but the resistance continues to overpower. Another failed attempt post-earnings report could see the price retrace to the lower trendline once again. In this scenario, we would then look for a bounce off the trendline upon consolidation along it, correspondingly with the price setting a higher low. This is highlighted by the arrows on the chart. However, a strong earnings release may see a break and close above the upper trendline. Resistance sits in the zone marked with the yellow oval, $391.72. Hence, if this level can be broken we would then look at resistance sitting at $410.96. Towards the downside, support sits at $363.53 followed by $359.78. A break below these levels could then see the price slide lower towards the trendline support of $329.92. Looking at the technical indicators, MACD has turned negative but the volume isn’t too high for the time being. RSI has just turned to neutral from positive as it now reads 54.

Tradable assets:
Min.Deposit:
Max Leverage:
FCA:

Rating:


