Test- FTSE 100 Kicks Off August on a High as BP and Senior Lead Market Momentum
$11
10 Oct 2025, 13:13
Neutral
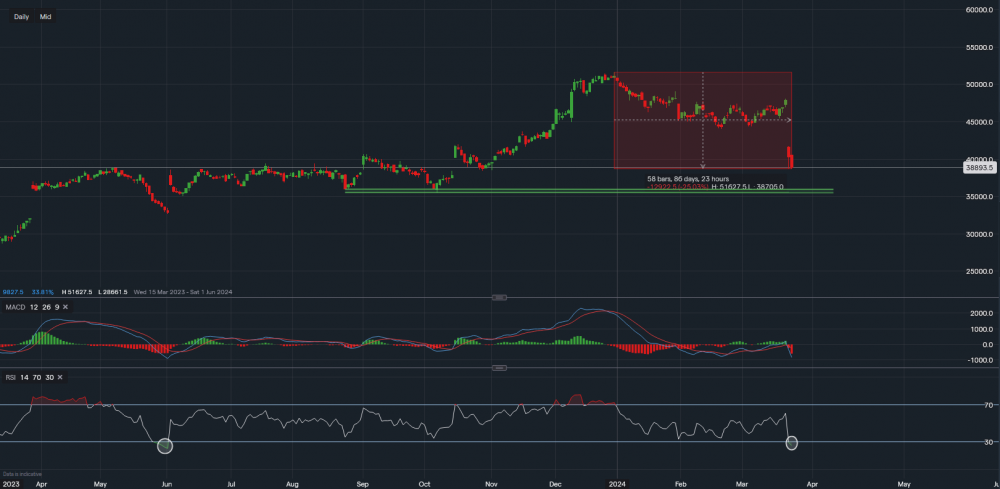
Chart & Data from IG
Taking a look at Lululemon as its stock has now fallen 25% from its peak. Currently, its shares closed yesterday’s session at $388.93 a share. We can see that on the daily chart, the stock gapped down from Thursday 21st of March to Friday 22nd of March, this has led to further selling pressure. The next support level in focus is the level of $384.45. A break below this level would increase the likelihood of a further decline towards the October lows of last year, or respectively, the area of $354.72-$359.78 (highlighted by the green base channel). It would be unreliable to try and determine any potential resistance levels unless signs of consolidation are present. However, looking at the technical indicators, in particular the RSI, we can see that it is suggesting the stock is now somewhat oversold. The last time the RSI was at a similar level was back in June of last year, which led to a bounce of around 15%. This by any means is not an indication to buy, and even if the share price is to bounce back it is not guaranteed to rise by a similar gain. Back in June, the RSI was at such levels for 6 days before the bounce, meaning that further selling cannot be ruled out before any sort of ‘bottom’. But if there were to be a bounce this week, a 3-4% move would be an honest gain.

Tradable assets:
Min.Deposit:
Max Leverage:
FCA:

Rating:


