Test- FTSE 100 Kicks Off August on a High as BP and Senior Lead Market Momentum
$11
10 Oct 2025, 13:13
Neutral
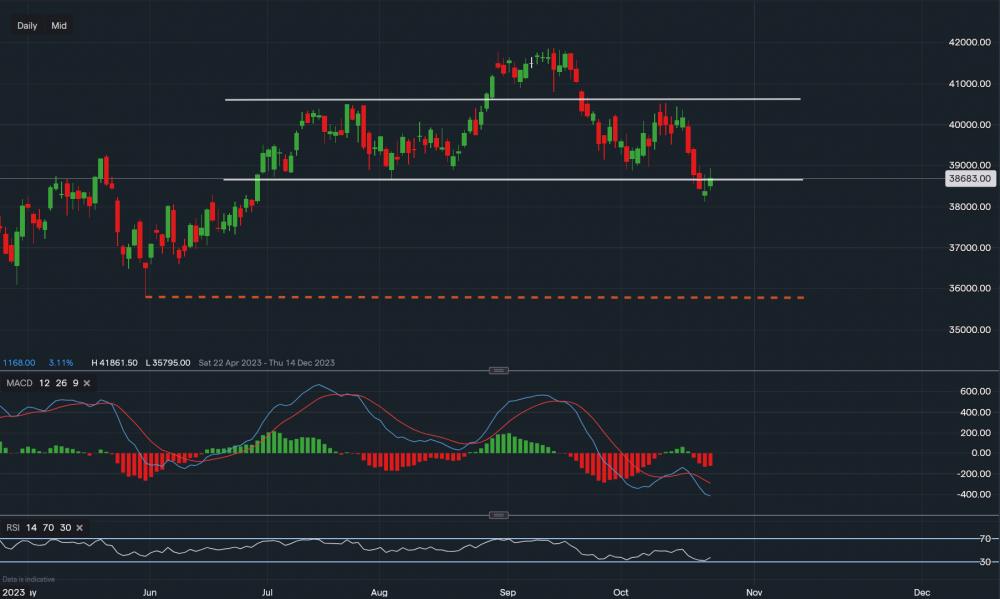
Chart & Data from IG
Taking a look at Mastercard ahead of its earnings tomorrow. Currently, its shares are trading at around $386.83 a share, we can see that the price has fallen below the trendline support of $386.50 and closed below it. It seems like a head and shoulders pattern has formed which aided the downside pressure, this is a bearish indication. However, as the company is reporting earnings we may see a move back into the channel drawn on the chart. This can also be classed as a false breakout, hence, any investments/positions should be taken with caution ahead of the report. As the price has closed below the trendline, it does open the possibility for further downside with the next major support at $357.96 (dotted trendline). However, a move towards that level would be more likely if the price falls below yesterday’s low of $381.17. A move back into the channel would then allow us to look at potential resistance levels, with the key resistance then at $395.28. A move above $395.28 could see a push towards the upper trendline of the channel. Looking at the technical indicators, they re both negative with the MACD strongly in the red and the RSI reading 37.

Tradable assets:
Min.Deposit:
Max Leverage:
FCA:

Rating:


