Test- FTSE 100 Kicks Off August on a High as BP and Senior Lead Market Momentum
$11
10 Oct 2025, 13:13
Neutral
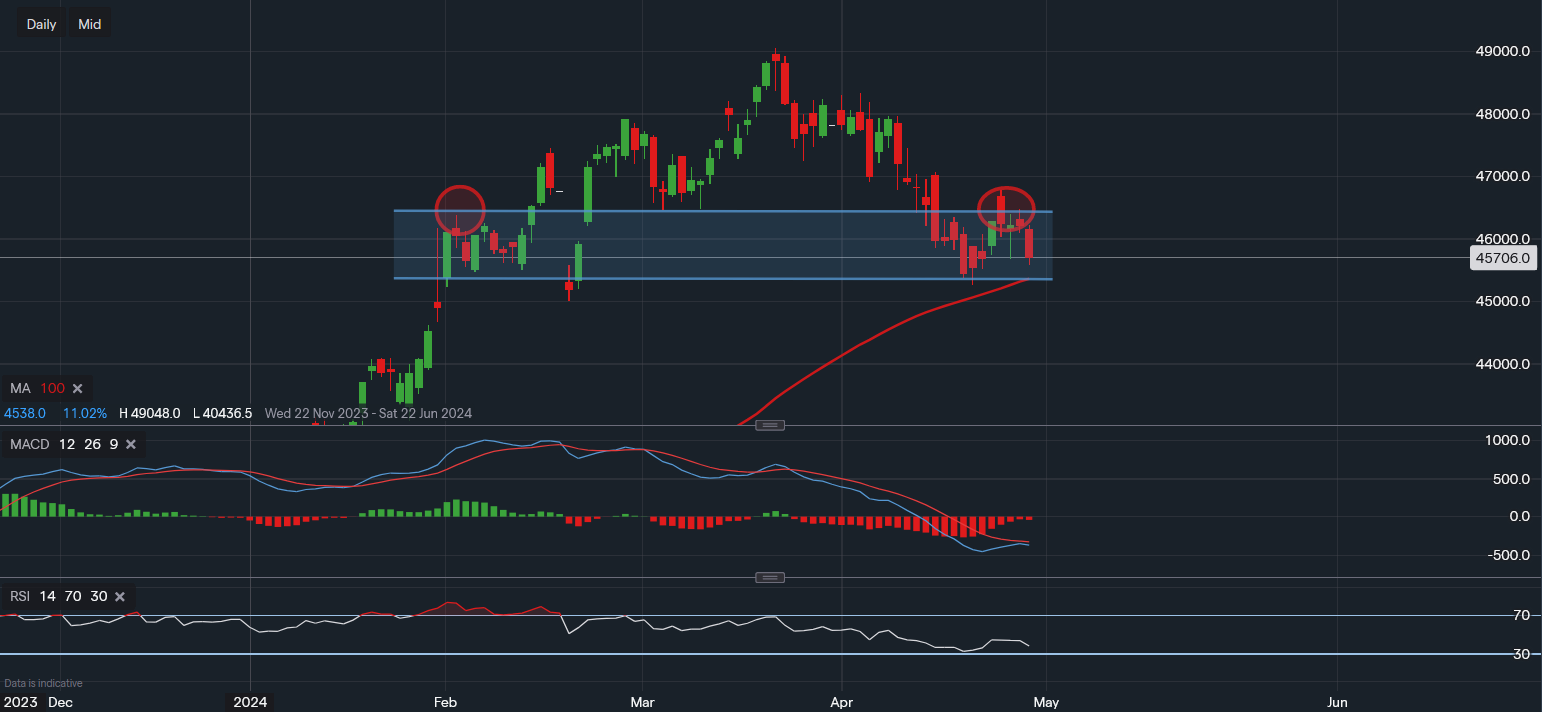
Chart & Data from IG
Taking a look at Mastercard ahead of its earnings tomorrow. The stock closed yesterday’s session at $457.06 a share as it continues its sell-off from the high of $490.48. Based on the daily timeframe, we can see that it has retraced to its 100-day moving average with a new support level formed at $452.58. The price tried to then move higher but found resistance at $467.89. This timeframe highlights a possible head and shoulders formation as demonstrated by the blue channel and ovals drawn on the chart. A break below $452.58 and then below $450.12 would confirm this, leading to an increased likelihood of a further decline to around $430-$435. On the other hand, a break above the resistance of $467.89 (potential shoulder on the right-hand side) could lead to a resumption of momentum driving the price back up. The target area for investors would then become $475-$480. Looking at the technical indicators, MADC volume has flattened but still, the bias sways more to the downside. The RSI is negative and falling. Hence, the overall bias is bearish. But when it comes to earnings, the bias at times has no relevance.

Tradable assets:
Min.Deposit:
Max Leverage:
FCA:

Rating:


