Test- FTSE 100 Kicks Off August on a High as BP and Senior Lead Market Momentum
$11
10 Oct 2025, 13:13
Neutral
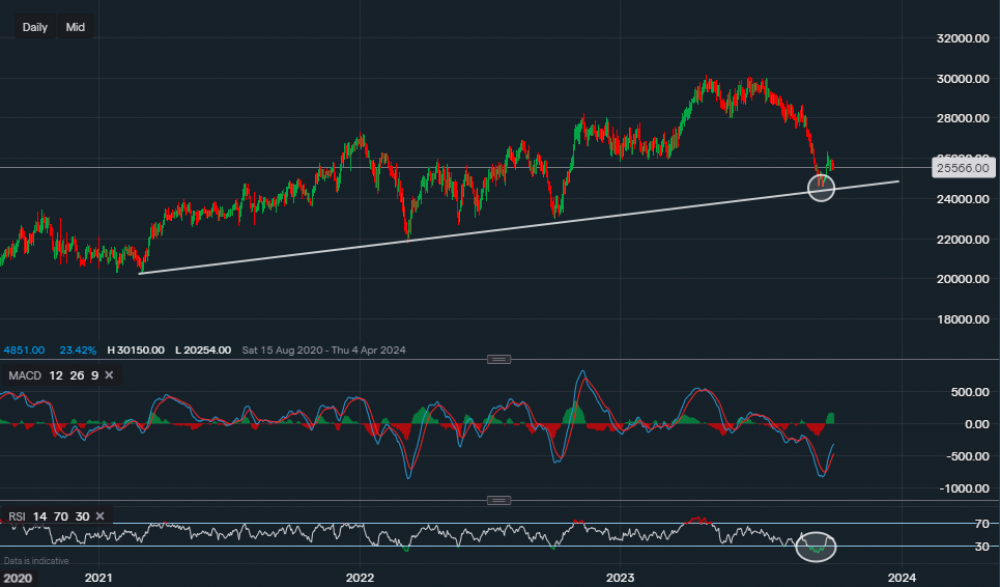
Chart & Data from IG
McDonald’s is expected to report its quarterly earnings on Monday. Looking at the chart on the daily interval, we can see that since our last post suggesting a possible bounce higher as the RSI was indicating that the stock was oversold, its price reached $263.51 a share. It has now retraced back a little ahead of its earnings, currently trading at around $255.56 a share and has mostly moved sideways over the last 4 days. The resistance now sits at $263.51, a break and close above it could see the price rise higher towards October’s high point of $264.84. If the price can overcome October’s high point, then a push towards $270-$273 would be likely. Whereas the support sits at $253.33. A break and close below it could then see McDonald’s price slide back towards the trendline support for a re-test. The technical indicators are a little mixed ahead of the earnings call, with the MACD rather positive but the RSI is slightly negative as it reads 42.
 (Chart & Data from IG)

Tradable assets:
Min.Deposit:
Max Leverage:
FCA:

Rating:


