Test- FTSE 100 Kicks Off August on a High as BP and Senior Lead Market Momentum
$11
10 Oct 2025, 13:13
Neutral
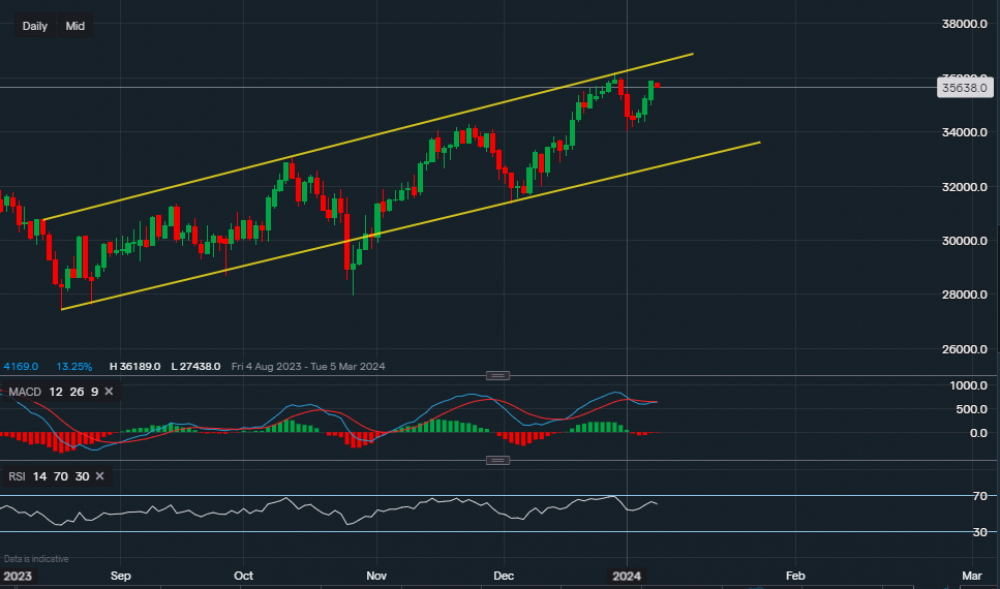
Chart & Data from IG
Meta’s stock is trading at around $356.38 a share right now. Looking at the chart from the technical viewpoint, the price has remained within the channel drawn on the chart. The chart presents a daily timeframe view, we can see that apart from one occasion where the price moved out of the channel (back in October due to earnings news), it has stayed within its support and resistance zones. The most recent resistance that is in focus is the price level of $361.89. The price did fall after reaching, perhaps due to partial profit taking, but it is now trying to test this resistance once more. A break above this resistance should see the price push higher, edging closer to its all-time highs. However, we could see another small pullback if a new resistance was to be established. On the other hand, with key data upcoming this week, it is not clear whether Meta will see a test of this resistance this week. Inflation data is due Thursday and Friday, it could well sour the investor sentiment, hence, support levels require close attention. Currently, the primary support preventing any further movement lower is the level of $341.75 followed by $340.03. A break below these levels could then well see the price slide further with the key support along the lower trendline of the channel, reading $332.77. If we head over to the technical indicators at the bottom end of the chart, they do not offer much incentive. The MACD is practically flat and the RSI is sliding, although it is still positive as it reads 61.

Tradable assets:
Min.Deposit:
Max Leverage:
FCA:

Rating:


