Test- FTSE 100 Kicks Off August on a High as BP and Senior Lead Market Momentum
$11
10 Oct 2025, 13:13
Neutral
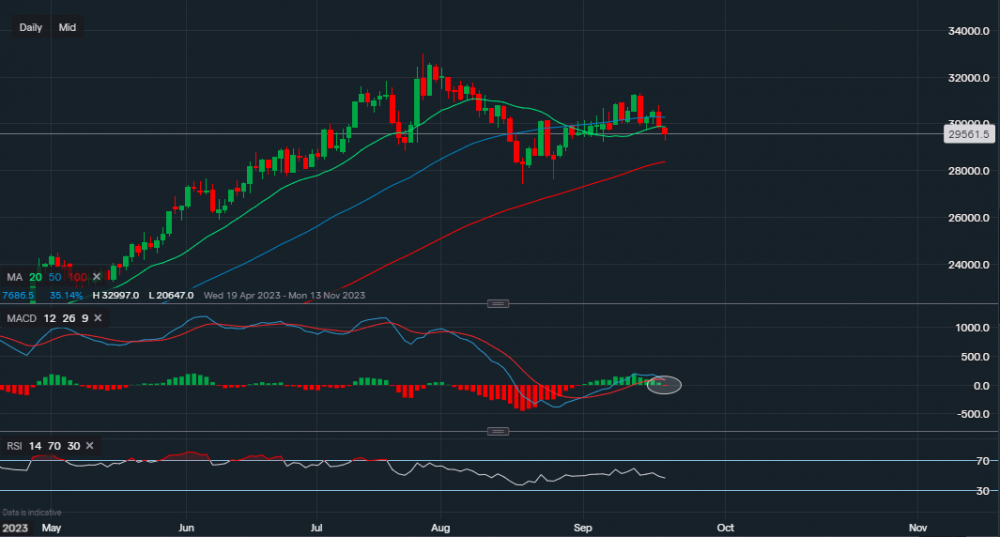
Chart & Data from IG
Taking a look at Meta as the technical indicators on the daily interval suggest that downside is possible in the short-term. Currently, its stock is trading at around $295.61 a share and the price has now fallen below both the 20 & 50-day moving averages. Minor support sits at $292.30 and a break below this level could see the price slide lower towards the tougher support along the 100-day moving average, which currently reads $283.82. A move and close below the 100-day MA may see a test of the hammer doji candlesticks, they hold levels of $276.06 and $274.41. Providing good support for the stock. It would be unreliable to look at any resistance levels for the time being as the near-term bias has turned bearish. Unless we see any consolidation around current levels. If we take a deeper look into the technical indicators, we can see that the MCAD is on the verge of turning negative (white oval on chart) and the RSI is faltering as it reads 46, though still in theory neutral right now.

Tradable assets:
Min.Deposit:
Max Leverage:
FCA:

Rating:


