Test- FTSE 100 Kicks Off August on a High as BP and Senior Lead Market Momentum
$11
10 Oct 2025, 13:13
Neutral
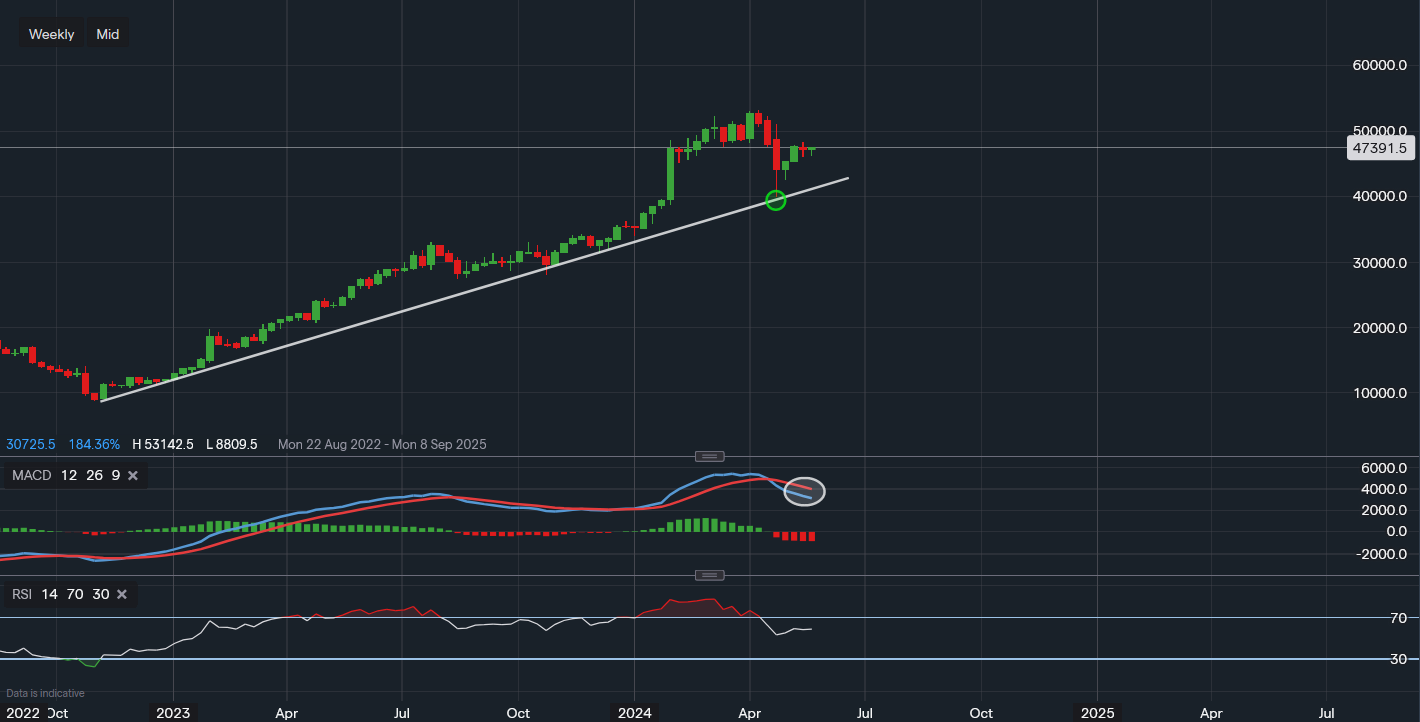
Chart & Data from IG
Meta has now found support here at $399.50 on the weekly chart, which sits along the ascending trendline from November of 2022. Currently, its shares are trading at around $473.91 in the pre-market trade and are up 1.2%. The price is now finding resistance at $482.45 after a small bounce over the past couple of weeks. A break above this resistance would entice the bulls to once again target that $500 mark. Minor support at $460.10, a dip below could see a slide towards $425.24, and maybe even trendline support once again for a re-test. The near-term outlook is a little mixed right now for Meta. Its tech peer Nvidia reported earnings yesterday, smashing expectations and releasing positive guidance for the next quarter. This has boosted the tech stocks so far going into today’s US open. However, we can see that the MACD is still negative and declining, which is a slight concern. This may hold the stock from moving higher, as momentum has stalled, although it is not guaranteed to do so. A flat MACD would offer room for consolidation and therefore provide greater confidence for investors. Nonetheless, our second favourite technical indicator, the RSI, is still positive and flat as it reads 58.

Tradable assets:
Min.Deposit:
Max Leverage:
FCA:

Rating:


